16 results
7th grade statistics homeschool curriculum microsofts
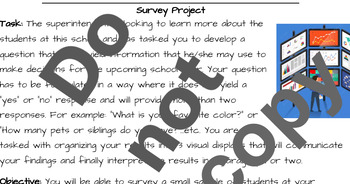
Samples & Population Survey Project
Students conduct a survey project to draw a generalized assumption based on the data collected about the whole population at their school. This project is fun and interactive, using real-world application of mathematical concepts covered in class.
Subjects:
Grades:
7th
Describe the Distribution of a Data Set
This Common Core statistics and probability lesson teaches students how to describe the distribution of a data set. The lesson includes research-based strategies and strategic questions that prepare students for Common Core assessments. In this lesson, students will describe the distribution of data sets. This lesson focuses on describing a variety of statistical distributions in different situations. Students are asked to describe different related data sets and describe what that means. In
Subjects:
Grades:
5th - 7th
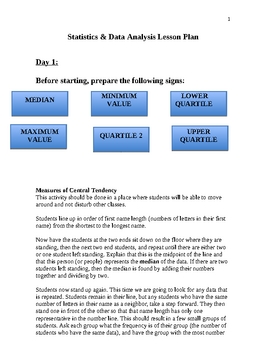
Up and Moving With Data Analysis and Statistics
Get your students up and moving as they create living graphs and actively find the median, mode, range, minimum and maximum values, upper and lower quartiles and never forget how they formed a box and whisker graph. Students will then collaborate on a survey project which will explore line plots, line graphs, bar graphs, histograms, circle graphs, scatter plots and stem and whisker plots. The unit will culminate with a discussion on biased questions and misleading graphs. A detailed rubric is at
Subjects:
Grades:
5th - 8th
Solve Percent Problems Using Proportions
This Common Core ratios and proportional relationships lesson covers how to solve multistep percent problems using proportions. The lesson includes research-based strategies and strategic questions that prepare students for Common Core assessments. In this lesson, students determine what the question is asking, and then the corresponding percent and quantity by drawing a diagram. Then, they set up a proportion for the percent and quantity, cross multiply, and solve for the unknown quantity. Fina
Subjects:
Grades:
6th - 8th
Types:
Mean, Median, and Mode, Stem & Leaf Plot
This visualized Power Point Presentation helps students to see how to find the mean, median, mode using graphics and charts. Step by step guided instructions.
Subjects:
Grades:
7th
Statistics Review
This review comes with three options for students to complete to Statistics. Each option allows for students to use various levels of taxonomy.Version A: Students will calculate the mean, median, mode, and range for the following set of data. Version B: Students will apply their knowledge of Statistics to solve various real-world problems.Version C: Students will collect data from friends/family and use it to create meaningful statistics.This assignment can be used to review statistics, reinforc
Subjects:
Grades:
5th - 7th
Also included in: 6th Grade Summer Review
Introduction to Probability PowerPoint Presentation with practice
Learning Target:•I can determine the likelihood of an event happening.
Subjects:
Grades:
6th - 7th
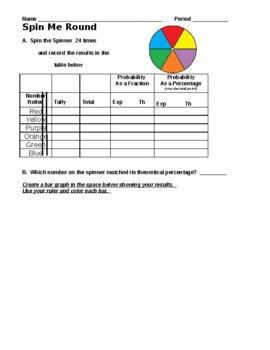
Spinner Exploration (Probability)
Let's student find theoretical and experimental probability
Subjects:
Grades:
5th - 11th
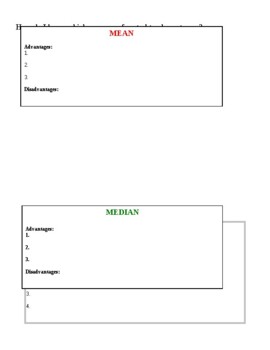
Differences and Uses of Mean, Median, and Mode Explained
One page of notes and the answers
Subjects:
Grades:
4th - 8th
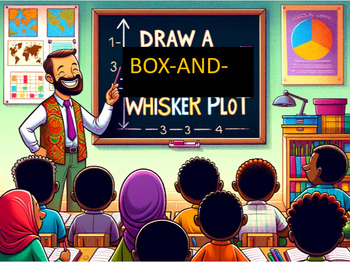
Lesson plan on DRAWING A BOX-AND-WHISKER PLOT (Super easy to follow)
Lesson plan on DRAWING A BOX-AND-WHISKER PLOT. Includes do now, lesson, practice problems, discussion questions, and answer key!
Subjects:
Grades:
6th - 8th
CCSS:
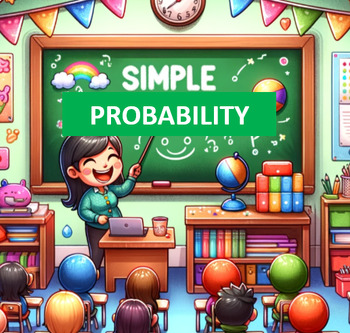
Lesson plan on SIMPLE PROBABILITY (Super easy to follow!)
Lesson plan on SIMPLE PROBABILITY. Includes Do Now, Lesson, Practice Problems, Discussion Questions, and Answer Key.
Subjects:
Grades:
6th - 8th
CCSS:
Lesson Plan on BOX-AND-WHISKER PLOTS / PERCENT OF DATA BETWEEN SUMMARY NUMBERS
Lesson plan on finding what percent of the data lies between any two summary numbers of a box-and-whisker plot. Includes do now, lesson, practice problems, discussion problems, and answer key!
Subjects:
Grades:
6th - 8th
CCSS:
Lesson plan on MEAN ABSOLUTE DEVIATION (Super easy to follow)
Lesson plan on MEAN ABSOLUTE DEVIATION. Includes do now, lesson, practice problems, discussion questions, and answer key!
Subjects:
Grades:
6th - 8th
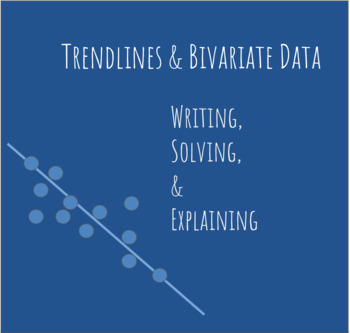
Trend Lines - Writing Equations & Solving - Handout OR Digital!
In this 5 part assignment, students will examine given trend lines and identify the information they need to complete each part. This includes finding starting values, slopes, writing equations and making predictions about unknown values.
Subjects:
Grades:
7th - 8th

Lesson plan on RANGE (Super easy to follow)
Easy-to-follow lesson on RANGE . Includes do now, lesson, practice problems, discussion questions, and answer key.
Subjects:
Grades:
6th - 8th
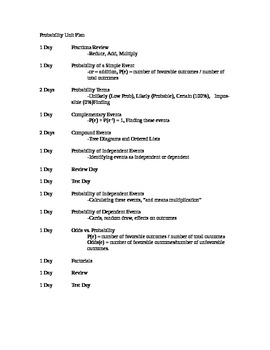
Probability Unit Lesson Progression
This document illustrates a lesson progression and pacing that will teach the seventh grade CCSS for probability. The progression assumes basic knowledge of operations with fractions. Skill review lessons are available.
All lessons listed in this document are available on my site. All lessons can be paired with a lesson video for a flipped classroom or to be used with absent students.
All lessons listed include an integer warm-up and a homework task at the end of the SMART Notebook slides.
Subjects:
Grades:
6th - 8th
Showing 1-16 of 16 results


