27 results
7th grade statistics research microsofts
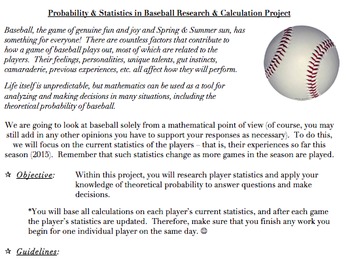
Probability & Statistics in Baseball Project (Common Core Aligned, AND FUN!)
The problems and activities within this document are designed to assist students in achieving the following standards: 6.SP.B.5, 7.SP.C, HSS.CP.A.2, HSS.CP.A.3, HSS.CP.B.7, HSS.CP.B.9, as well as the standards for mathematics practice and the literacy standards. They are also designed to help the teacher assess the students’ abilities when it comes to working with the ideas within the standards.This document contains the following:A project designed to allow students to investigate theoretical
Subjects:
Grades:
5th - 12th, Higher Education, Adult Education, Staff
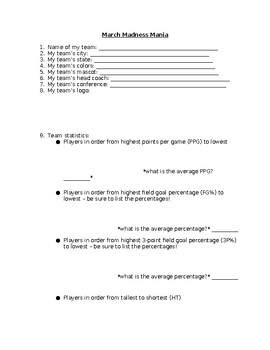
NCAA March Madness Basketball Tournament Team Research Statistics
Do you have students interested in the March Madness basketball tournament? Then this is the activity you need!To begin our March Madness unit, we look at all of the teams participating in the tournament and complete a map together to show where each team is from. We notice that some states have more than others and some states have none, and spend time discussing why that might be. Students will complete their own March Madness bracket.Students will then select a team in the NCAA March Madness
Grades:
4th - 9th
Types:

Scatter Plot and Bivariate Data Research Project
Students will begin a statistics project on one of their favorite restaurants or food chains! They will be researching nutrition facts and surveying others on what types of food they like to eat there. Through this data collection they will work on their skills of creating scatter plot graphs, creating relative frequency tables, and analyzing this data. This can be used either by paper or digitally. I used it the last two years during distance learning. Rubric included.
Subjects:
Grades:
7th - 12th
Types:
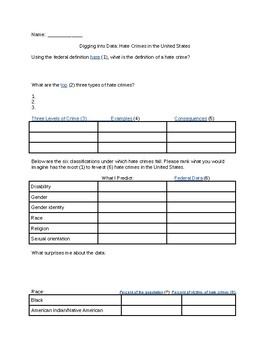
The 57 Bus- Looking at Hate Crime Data
A guided web search on hate crime data from the FBI, CDC, Pew Research Center, and U.S. Census Bureau. Uses reflection questions to make conclusions and predictions about the distribution of hate crimes. The kids are fascinated by the data!
Subjects:
Grades:
7th - 12th, Higher Education, Adult Education
Types:
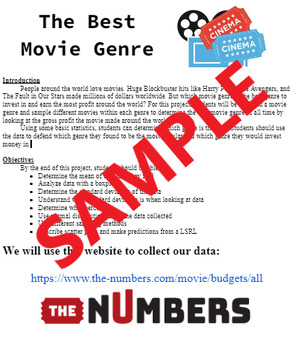
The Best Movie Genre Project (Statistics Class)
High School and Middle School Statistics Class Project. People around the world love movies. Huge Blockbuster hits like Harry Potter, the Avengers, and The Fault in Our Stars made millions of dollars worldwide. But which movie genre is the best genre to invest in and earn the most profit around the world? For this project, students will be assigned a movie genre and sample different movies within each genre to determine the best movie genre of all time by looking at the gross profit the movie ma
Subjects:
Grades:
7th - 12th, Higher Education
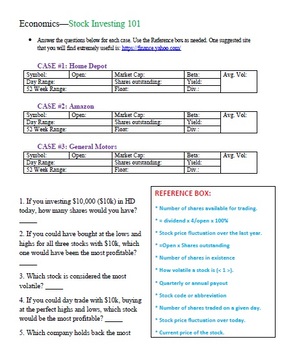
Stock Investing 101
For high school (and savvy middle school) economics students, Stock Investing 101 is a great tool for students to explore stocks on the Stock Market. This worksheet can be easily edited by simply changing the companies that the students need to investigate in order for it to be used over and over again. Estimated time for student completion: 45-60 minutes
Subjects:
Grades:
7th - 12th
Types:
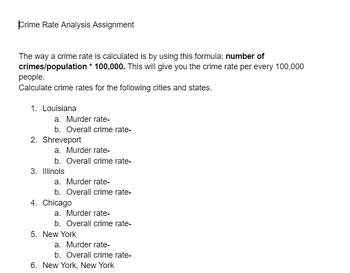
Crime Rate Analysis Assignment
A web based assignment to allow students to calculate the crime rates of various U.S. cities.
Grades:
5th - 12th, Higher Education, Adult Education
Types:
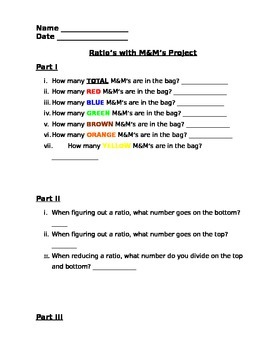
Ratios with M&M's Project
This is a quick assessment to help students figure out the ratios of M&M's in a bag. You provide the candy and I provide the worksheet. Students will be requested to open the bag, count all candies and than follow the directions marking ratios for each listed color.
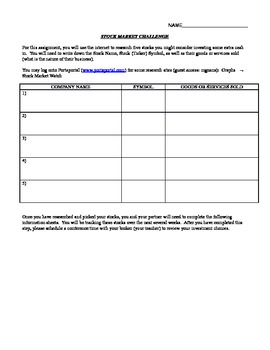
Stock Market Challenge Information Sheet
This document provides students a place to record the information they have gathered from their Stock Market research. It includes a place for students to record their stocks' 52-week high and low, dividends paid, does the company produce goods or provide services, as well as the reasoning as to why your student chose to purchase that particular stock. There are enough recording sheets for 5 stocks. This is a great way to teach students how to record and organize information for later use. If
Subjects:
Grades:
4th - 7th
Types:
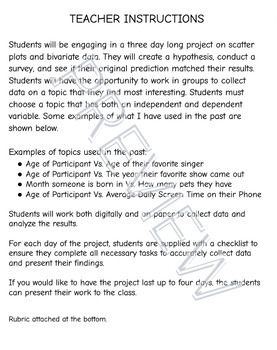
Scatter Plot and Bivariate Data Project
Students will be engaging in a three day long project on scatter plots and bivariate data. They will create a hypothesis, conduct a survey, and see if their original prediction matched their results. Students will have the opportunity to work in groups to collect data on a topic that they find most interesting. Rubric attached at the bottom.
Subjects:
Grades:
6th - 12th
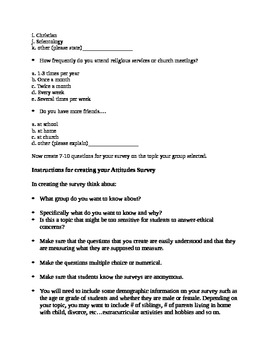
Research Paper-integrating Math and Science
This is a research paper that breaks down the topic and methodology into sections. The project is student driven. Student groups decide on a reseach topic that they can actually research but also create a survey to administer to students in the school so that they are collecting their own data.
The booklet begins with students creating survey questions, but you may want to first have them do the intro to the paper and their hypotheses before creating the survey questions.
Science is integrate
Subjects:
Grades:
7th - 12th, Adult Education
Types:
Primary and Secondary Data
This lesson is the lesson after "Samples and Populations". This lesson has the content included and will allow students to engage in a research project as they discover the different methods included in Samples and Populations. This lesson supports the textbook "Maths Quest 8".
The resources that you will also need for this lesson is butchers paper and marker pens.
Subjects:
Grades:
7th - 9th

Marketing research project / Sports & Entertainment
Marketing is part of every business including sports and entertainment. The sports and entertainment industry include many different participants. Sports and entertainment events can only be improved by surveying participants to determine what they like and what needs to be changed to make the event better.
Subjects:
Grades:
7th - 12th
Types:
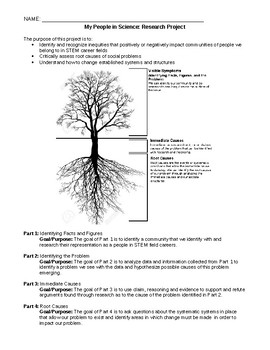
My People in Science Project
The purpose of this project is to:
• Identify and recognize inequities that positively or negatively impact communities of people we belong to in STEM career fields
• Critically assess root causes of social problems
• Understand how to change established systems and structures
Students will choose a community they identify with and will be conducting a thorough research project to find out this community's role in STEM subjects.
Grades:
6th - 12th
Types:
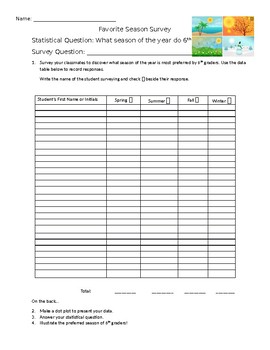
What is your favorite season? Practicing Statistics Class Survey
Students will practice the steps of statistics - gathering data, organizing data, analyzing data, interpreting and presenting data. Students will survey their classmates using the survey question, What is your favorite season? Students will practice statistical questions, data tables, dot plots and illustrations.
Subjects:
Grades:
5th - 8th
Types:
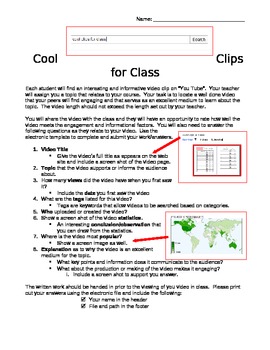
Cool Clips for Class: Using YouTube to Inform and Engage Students
This assignment involves students accessing the popular video website YouTube. The expectation is that student's research and document informative and engaging material that communicates an assigned topic or concept.
This activity includes a two page handout, a student question page that can be made available electronically with the questions for students to add answers and images and a peer evaluation sheet where students rate the videos presented by other students. The peer evaluation can
Grades:
7th - 12th
Types:
Using Data to Support a Hypothesis
In this math challenge, students must create a hypothesis and then collect and display data to support their hypothesis!
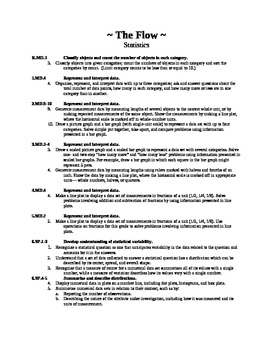
7th Grade Math Common Core Flow - Statistics
This product came about from an idea I heard about in a professional development over the summer. I have often wanted to know exactly what my students were "supposed" to know when they came to my class, but I also wanted to make sure that I didn't cover something that would presented in upcoming grades. When I can't find what I want, I often make it myself.
This document takes anything that relates to statistics in the Common Core from Kindergarten to Secondary Math 3 and lines it up. (7th grad
Subjects:
Grades:
7th
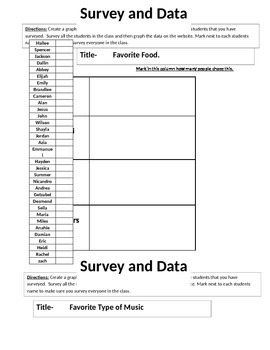
Collect Data for graphing worksheet
6 different worksheets for collecting data to create a graph. Includes a student check-off list to make sure that each student is surveyed. Fun engaging activity that will be a hit.
CLICK PREVIEW to see a detailed video about this lesson
If you like this lesson please follow us.
Subjects:
Grades:
3rd - 7th
Types:
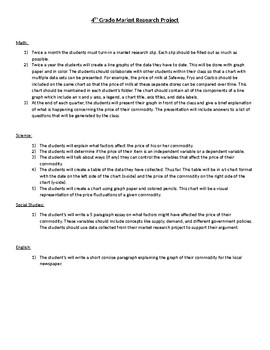
Market Research Project
This is a great project I am currently working on with my 4th grade students. We signed up to research various products that are commonly bought at the supermarket. Some of the items we are researching include spinach, milk, wheat bread, turkey, cheese, and peanut butter. Every other week we collect data by shopping or calling the store. We record the date the information is collected, the quantity of the product (ounces or fluid ounces), and the price of the product. We use this information to
Subjects:
Grades:
4th - 9th, Adult Education
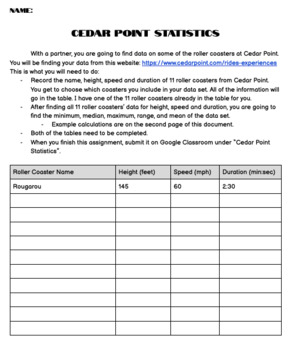
Cedar Point (Rollercoaster) Statistics
In this activity, students will research data for the speed, height and duration of rollercoasters. After retrieving this data, students will find the mean, median, range, minimum and maximum values of the data. How to find those calculations is also provided on the document. An extension could be to have students graph the data they collected. I have used this for a sub day in my engineering classes a few times.The example I provided uses coasters from Cedar Point because that park is located n
Subjects:
Grades:
5th - 8th
Types:
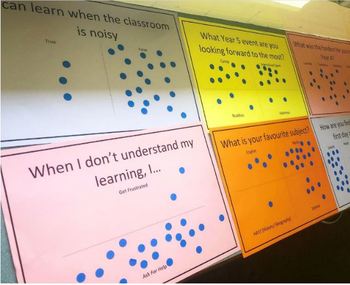
Student Survey
Editable survey posters which allow students to respond anonymously and presents very visual results. Fantastic for students to reflect and an effective tool to inform future teaching.Sized for A3 paper as a editable document. Students will need stickers for responding, one sticker per poster per student. Thank you for downloading! Feel free to tag @incursiveshewrote on Instagram when sharing your posters!
Grades:
4th - 12th
Types:
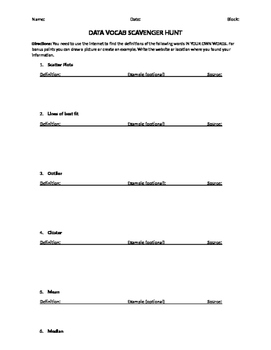
Vocabulary Internet Scavenger hunt- Data
Students are asked to define 10 words related to the statistics and probability standard for Common Core 8th grade. They then need to list an example and the source where they found their information. It can be done electronically or on paper.
Subjects:
Grades:
7th - 8th
Types:
SPSS software Secondary Data Analysis Workshop (Introductory/AP Statistics)
This handout is intended for those interested in teaching/learning basic introductory statistics concepts to analyze real data. Students will learn how to tell a story using secondary data analysis. The handout is for SPSS and the US Longitudinal Study of Adolescent Health data set. For handouts on the data set code book and raw data file, a PowerPoint to accompany the handout, or questions please email kristin.flaming@gmail.com or ldierker@wesleyan.edu.This handout was developed as a condensed
Subjects:
Grades:
6th - 12th, Higher Education, Adult Education
Types:
Showing 1-24 of 27 results


