166 results
7th grade statistics project microsofts
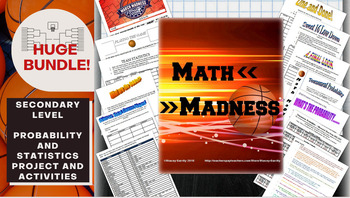
Math March Madness Full Tournament Project {BUNDLE}
Harness the excitement of NCAA March Madness with this huge project for secondary math teachers that follows all stages of the tournament! This Common Core aligned bundle comes with bonus parts not sold individually in my store so you can create a rich immersion in the tournament, practice probability and statistics and learn some interesting new ones along the way! Save $3 plus get bonus content by bundling!You can pick and choose which parts you would like to incorporate, or follow my schedu
Subjects:
Grades:
6th - 12th, Higher Education
Types:
Statistics Project - Statistics Olympics
Engage your students in their study of statistics as they compete in self-created Olympic style events. This project will engage students and help them discover meaning and apply concepts including measures of central tendency, quartiles, outliers, variance, standard deviation, z-scores, box plots, histograms, normal and skewed distributions. This project can be completed in approximately 6-8 days (50-min class periods) ** March 2023 Update **Visual updates to all slides and documentsRubric ali
Subjects:
Grades:
6th - 12th
CCSS:
Mean, Median, Mode, and Range (Bundled Unit) - Distance Learning
This is an enjoyable, interactive, and engaging bundled unit covering mean, median, mode, and range (and introduces outliers). This unit is great for 5th and 6th graders and 7th graders who struggle with these concepts.Included in this bundled unit:PowerPointAnimated and fun 4-part, 21-slide PowerPoint (multi-day use)-Part 1 – The Meaning of Mean-Part 2 – Getting in the Middle of Median-Part 3 – Making the Most of Mode-Part 4 – Home, Home on the RangeEach section offers plenty of practice probl
Subjects:
Grades:
5th - 7th
Geometry: Survey and Circle Graph Project Made Fun!
Circle Graph Geometry Activity - Everyone just wants their piece of the pie!This is a fun, multi-faceted project that will have your students creating and implementing a survey, converting their results using various mathematical operations, and creating a poster-sized circle graph incorporating various geometry skills.This Survey and Circle Graph Project Unit Includes:PowerPoint:-Fun, interactive, 3-part PowerPoint slide presentation that walks you and your students through the entire project f
Subjects:
Grades:
5th - 7th
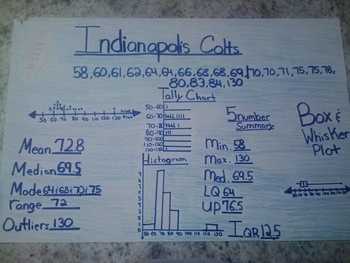
Favorite Sports Team: Data Displays and Measures of Central Tendency Project
Students will create a poster using sports statistics. Depending on the time of year, you may want to use football scores, basketball scores, data from the Olympics, etc. Students will use the internet (or you can print out statistics for them) to find sports data.
The students really buy into this project because it is about something they are interested in - their favorite sports team!
Students will display their knowledge of several data displays: line plot, tally chart, histogram and bo
Subjects:
Grades:
5th - 8th
Types:
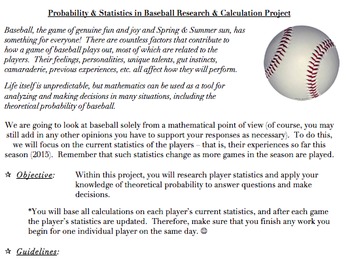
Probability & Statistics in Baseball Project (Common Core Aligned, AND FUN!)
The problems and activities within this document are designed to assist students in achieving the following standards: 6.SP.B.5, 7.SP.C, HSS.CP.A.2, HSS.CP.A.3, HSS.CP.B.7, HSS.CP.B.9, as well as the standards for mathematics practice and the literacy standards. They are also designed to help the teacher assess the students’ abilities when it comes to working with the ideas within the standards.This document contains the following:A project designed to allow students to investigate theoretical
Subjects:
Grades:
5th - 12th, Higher Education, Adult Education, Staff
Probability project using Real-World March Madness Tournament
Jump into the March Madness tournament to apply probability concepts to a real-world application. Great for your sports-loving students. Students explore probability first by determining the probability that a team will win. Students, further, weight teams based on historical data and/or team statistics. This mini-project allows for creative problem-solving and has some open-ended answers.Included in this resource:★ Student pages for 3 March Madness related activities★ Detailed guidelines fo
Subjects:
Grades:
7th - 10th
Types:
Also included in: 7th Grade Math Resource Bundle
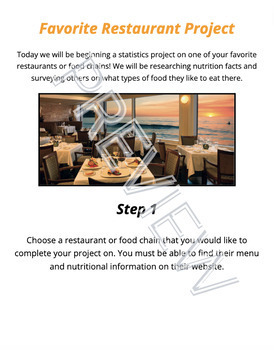
Scatter Plot and Bivariate Data Research Project
Students will begin a statistics project on one of their favorite restaurants or food chains! They will be researching nutrition facts and surveying others on what types of food they like to eat there. Through this data collection they will work on their skills of creating scatter plot graphs, creating relative frequency tables, and analyzing this data. This can be used either by paper or digitally. I used it the last two years during distance learning. Rubric included.
Subjects:
Grades:
7th - 12th
Types:
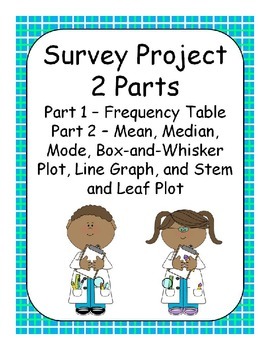
Survey Project - Frequency table, Mean, Median, Mode, and Various Plots
This project is a 2 part project about different ways to display data.
In part 1, Students will create a question with 4-6 possible answer choices. After surveying 50 different people, students will create a frequency table displaying their data. There are questions for students to answer about the survey and the people they’ve surveyed.
In part 2, students will create a question that will trigger an answer that is a number. After surveying 25 different people, students will find the mean,
Subjects:
Grades:
5th - 7th
Types:
CCSS:
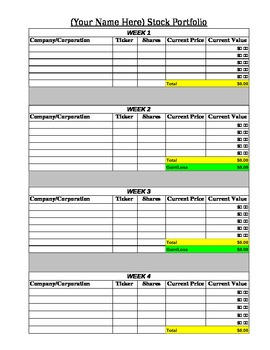
Stock Market Portfolio Tracking Spreadsheet
This document is an Excel spreadsheet which has already been formulated for students to use as part of a Stock Market unit. As students research and track their stocks, they will enter their data into the spreadsheet and their profit/loss will be automatically calculated along with a graph for students to analyze their results.
Subjects:
Grades:
4th - 8th
Types:
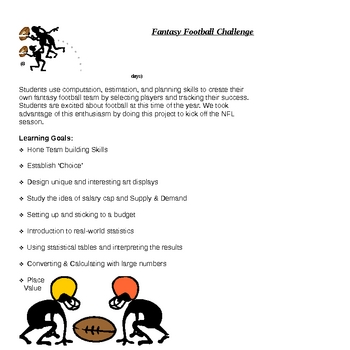
Are You Ready for Some FOOTBALL? (Middle School MATH Project)
Are you looking for a unique way to engage your students in authentic math concepts using real-world data that will blow their socks off? If so, this is your project! I have used this with eighth graders, but it would work well with any middle school performance indicators. This project involves so many performance indicators - estimation, rational numbers, scientific notation, number & word forms, budgeting, graphs, statistics, integers, media, cooperative learning, research, technology, vi
Subjects:
Grades:
5th - 8th
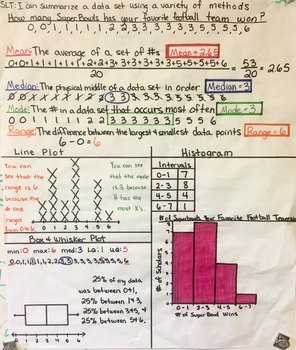
Statistics Project Line Plot Histogram Box & Whisker Measures Central Tendency
Your purchase comes with the rubric and checklist pictured above, I had scholars get their checklist signed after each part, when all signatures were collected they were given their poster paper. This project allows scholars to come up with their own statistical question, collect data from their peers, and then prepare a poster to summarize their data. The poster includes the data set, measures of central tendency (mean, median, mode, & range), line plots, histograms, box & whisker plots
Subjects:
Grades:
6th - 7th
Types:
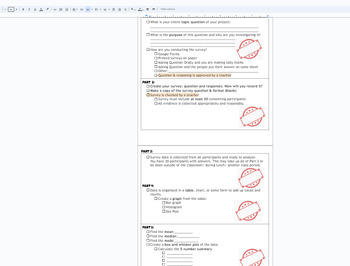
Statistics Survey project Discovery (broken down into sections) with Rubric
This is a broken down (scaffolded) packet of instructions/ guide for a Stats Project for Math 1 HS or 8th grade students. The goal of the project is for students to take a statistical survey on quantitative data (numbers) of their choice. Using this data from the survey, the following will be included in the project:Survey- the question being askedSurvey responses (requirement of 30)Data organization: Bar chart, Histogram, Dot PlotMeanMedianModeBox and Whisket Plot5 number summary (Q1,Q2,Q3, min
Subjects:
Grades:
7th - 12th, Higher Education, Adult Education
CCSS:
Algebra 1 - Statistics Project
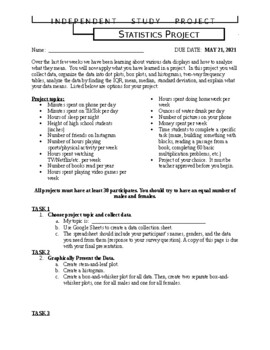
Tired of doing tests? Especially by the time you get to the statistics chapter, you and your students both probably are! Here is an alternative summative assessment for you!This statistics project tasks students with conducting a survey to collect data. Then, students must graphically represent the data, analyze the data by performing statistical calculations, and interpret the data.Students really enjoy this project!!
Subjects:
Grades:
7th - 10th
Types:
Manipulating Data & Creating Bias Activity
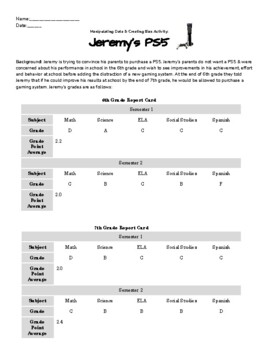
Manipulating Data & Creating Bias Activity: Teach your students about how charts and statistics can be skewed; and real numbers can reflect bias with this fun project! Students are given a role (either Jeremy or his parents) and have to use two pieces of data from Jeremy's 6th & 7th grade report card to argue for or against his deserving of a PS5!Students get to be creative & make cross-curricular connections to ELA as they use logical fallacies & skewed graphs to make their argu
Subjects:
Grades:
4th - 11th
Types:
CCSS:
NGSS:
HS-ETS1-4
Data & Statistics Final Project
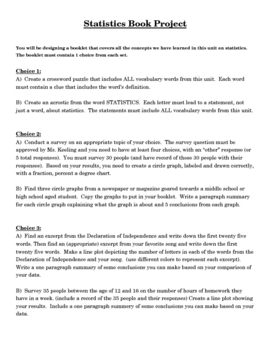
This final assessment covers topics from a data and statistics unit at the middle school level. The project covers such topics as histograms, bar graphs, circle graphs, line plots, scatter plots, misleading graphs, measures of center (mean, median, mode)and any vocabulary from the unit. The project directions give the students two choices of activities for each of the topics listed above to complete as a final assessment. For example, the section that checks for their proficiency of circle gra
Subjects:
Grades:
6th - 9th
Types:
Tootsie Pop Activity w/ MMM, Stem and Leaf, Frequency Tables and Histograms
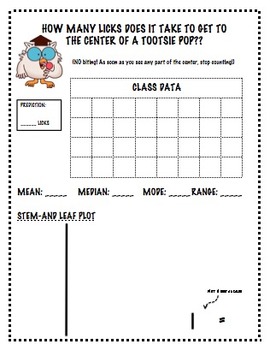
I would recommend using mini-Tootsie Pops so it doesn't take the kids forever to get to the center. I had them stop as soon as they saw any part of the center.
This activity gather data as a class and then students use the data to create a stem and leaf plot, frequency table and histogram. Student will also find mean, median, mode and range.
See my free download, "Tootsie Pop PowerPoint for a hook to get the kids started on this activity :-)
Subjects:
Grades:
6th - 8th
Types:
Samples & Population Survey Project
Students conduct a survey project to draw a generalized assumption based on the data collected about the whole population at their school. This project is fun and interactive, using real-world application of mathematical concepts covered in class.
Subjects:
Grades:
7th
7th Grade Math Weather Project - Data Analysis, Measure of Center
Editable PowerPoint: so you can make it your own.I made an example of what a project could look like also.Use this for mean, median, mode, range. You can add other things as well.Good for distance learning.
Subjects:
Grades:
6th - 8th
Types:
Spanish Survey Project: Samples & Populations Survey Project
Students conduct a survey project to draw a generalized assumption based on the data collected about the whole population at their school. This project is fun and interactive, using real-world application of mathematical concepts covered in class.
Subjects:
Grades:
7th
Types:
Presidential Data Analyst Math Project | Excel | Presentations | Presidents Day
Elevate your Presidents' Day lesson plans with this comprehensive Presidential Data Analysis Math Project, designed to engage students in a deep exploration of U.S. presidential history through mathematical analysis. This invaluable resource provides educators with everything they need to guide their students through a dynamic and informative project that combines historical research with mathematical concepts.**Key Features:**1. **Thematic Relevance:** - Aligned with Presidents' Day, this o
Subjects:
Grades:
7th - 10th

Box and Whiskers Plot Weather Project
This is an engaging Data and Statistics Project that integrates math and science. Students will have an opportunity to showcase their knowledge about what they have learned from the Data and Statistics Topic and more specifically Box and Whisker Plots. This project requires students to record the weather in cities around the world and the U.S. using weather.com, give the weather forecast for a specific world and U.S. city, create Box and Whisker Plots with 5-Number Summaries, and make an iMovie
Subjects:
Grades:
6th - 8th
Types:
NGSS:
MS-ESS2-5
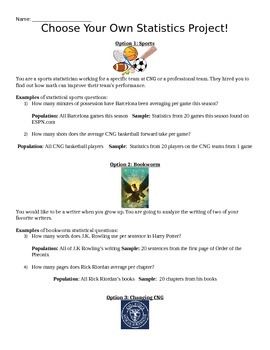
Real World Statistics Project
In this 6th-8th statistics project, students will choose one of 8 topics of interest and then collect data within their chosen topic. Topics include sports, music, shopping, and travel. Students will graph and analyze their data to discover how statistics is used in the real world.
A checklist rubric is included.
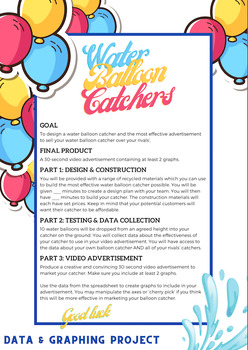
Water Balloon Catcher Project - Data and Graphing - Mathematics
Transform your maths classroom into a dynamic hub of learning with this captivating data and graphing project! Designed for upper primary/middle school students, this hands-on and inquiry-based activity ensures an immersive experience in mastering data interpretation, chart creation, and understanding the role of data and graphs in advertising.In this engaging project, students will: Explore Data: Collaborate in teams to design and construct a Water Balloon Catcher using recycled materials, each
Subjects:
Grades:
5th - 9th
Types:
Showing 1-24 of 166 results


