8 results
7th grade statistics rubric microsofts
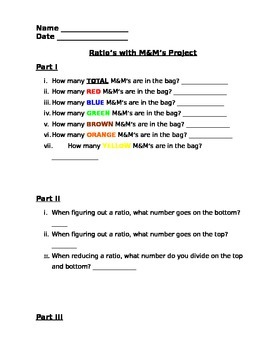
Ratios with M&M's Project
This is a quick assessment to help students figure out the ratios of M&M's in a bag. You provide the candy and I provide the worksheet. Students will be requested to open the bag, count all candies and than follow the directions marking ratios for each listed color.
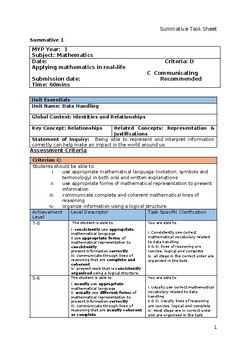
MYP-1_Data Handling_Criterion-C_D
This word document can be used as Summative/Formative assessment based on the topic Data Handling including topics- finding sector angle, constructing pie-charts, drawing dual bar-chart and writing conclusion on your infographics, what is the relationship between life expectancy and access to safe water? In your opinion, what can be done to improve access to safe water and increase life expectancy in countries with limited access to safe water? Explain your answer.It includes task specific des
Subjects:
Grades:
6th - 7th
Types:
Analyzing Misleading Graphs
Students are to find a graph online. They are given a url and other resources on how to find it. From there, they are to write a paragraph analyzing the validity of the graph. They are to include the title, resource, what the article is trying to convey, how it is/is not misleading, and at least two suggestions on how to make the graph more clear. Since this is a web-based assignment, it would be perfect for distance learning. Included:Student directions (in word doc so editable for your classro
Subjects:
Grades:
7th - 12th
Types:
CCSS:
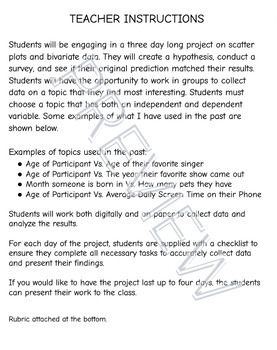
Scatter Plot and Bivariate Data Project
Students will be engaging in a three day long project on scatter plots and bivariate data. They will create a hypothesis, conduct a survey, and see if their original prediction matched their results. Students will have the opportunity to work in groups to collect data on a topic that they find most interesting. Rubric attached at the bottom.
Subjects:
Grades:
6th - 12th
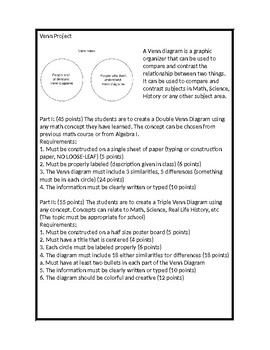
Venn Diagram Project
A Venn diagram is a graphic organizer that can be used to compare and contrast the relationship between two things. It can be used to compare and contrast subjects in Math, Science, History or any other subject area.
Subjects:
Grades:
3rd - 12th

Grade 6/7 Probability Game Design Project
This combines expectations from the Ontario 2020 Math curriculum for Grades 6 and 7. It asks students to work to collaborate and create an in-person, board game type game. There is a planning sheet and also a rubric included.
Subjects:
Grades:
5th - 7th
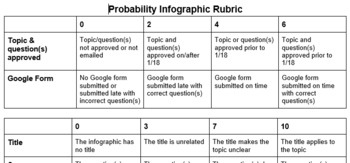
Probability & Statistics Project Rubric
This is the rubric for the Probability & Statistics Project:Students will use their knowledge of finding the probability of events, including multiplication and addition rules, as well as creating Venn diagrams or two-way frequency tables to create a project with real-world data.This rubric to makes grading quick and easy!
Subjects:
Grades:
6th - 12th
Types:
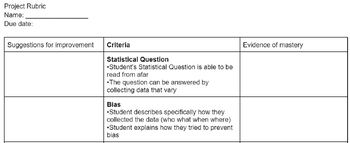
Statistics Project
Statistics project rubric. Throughout our statistics unit students completed small parts to the project, then I gave 50 minutes in class time for students to complete a poster summarizing their work. This is the 2 column rubric used.
Showing 1-8 of 8 results


