47 results
7th grade statistics lecture microsofts

Statistics Module Bundle
Dear Customers!This Statistics Module Bundle file contains 18 lectures which are covered during Statistics Module.Each lecture containing:- Lecture PPT- Test Bank with answers for each lecture - Exercises for seminars/lectures with answers
Subjects:
Grades:
6th - 12th, Higher Education, Adult Education, Staff
Data Representation Powerpoint
The presentation contains: 1) TALLY MARKS Learning Objectives. Definition of a tally mark. Uses of tally mark. How to count a tally mark. Tally Mark Chart. Construction of a tally mark table with an example. Application on real life problems on tally mark. Read and Interpret a tally mark table.The presentation contains: 2) FREQUENCY DISTRIBUTION TABLEDefinition of a Frequency Distribution Table. Types of Frequency Distribution Table: a) Discrete Frequency Distribution Table (Ungrouped).b) C
Subjects:
Grades:
1st - 10th, Higher Education, Staff
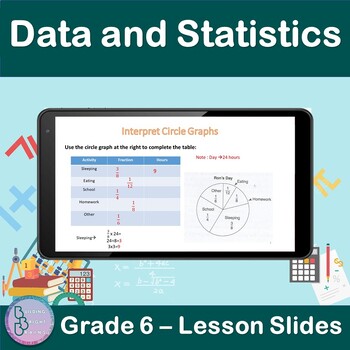
Data and Statistics | 6th Grade PowerPoint Lesson Slides | Circle Graphs
Are you teaching your students about Data and Statistics For 6th Grade? Plenty of examples and application exercises are included. You can also easily convert this to a Google Slides lesson by dragging it into your Google Drive.What is included?✦ 9 total slides for notes, examples and applications.✦ All steps are animated to allow the teacher to explain them gradually. At the end of the lesson, students will be able to✦ Interpret Circle Graphs.✦ Use a circle graph to complete s table.✦ Use a cir
Subjects:
Grades:
5th - 7th
A Roadmap for Analyzing Data (Statistics)
A Roadmap for Analyzing Data is a lecture which is covered within the Statistic or Basic Business Statistic module by business and economics students. Choosing appropriate statistical methods for your data is the single most important task you face and is at the heart of “doing statistics.” But this selection process is also the single most difficult thing you do when applying statistics! How, then, can you ensure that you have made an appropriate choice? By asking a series of questions, you can
Subjects:
Grades:
5th - 12th, Higher Education, Adult Education, Staff
Also included in: Statistics Module Bundle
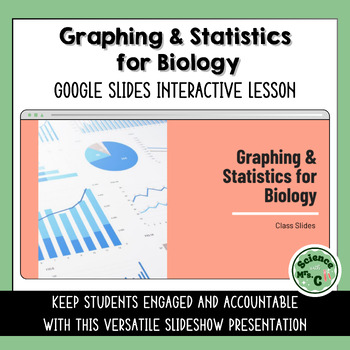
Graphing & Statistics for Biology Google Slides Lesson
Features a Google Slides lesson/presentation that reviews how to make scientific data tables, graph scientific data, and calculate mean, median, mode, and range.The topics covered in this presentation include:Identifying types of DataConstructing Data TablesCalculating Mean, Median, Mode, Range & Standard DeviationPlotting a GraphInterpolation & Extrapolation of DataKeep your students engaged and accountable with this interactive, versatile presentation. Embedded within these 27 colorful
Subjects:
Grades:
6th - 12th
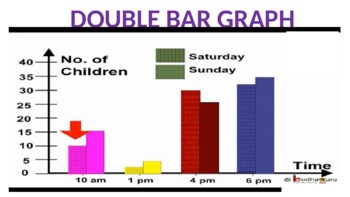
Double Bar Graph Powerpoint
The presentation contains:Learning Objectives.Definition of a double bar graph.Parts of a double bar graph.Difference between bar graph and double bar graph.Tips for construction of double bar graph.Steps to construct double bar graph with an example.To read and interpret the double bar graph.
Subjects:
Grades:
5th - 10th, Staff
Also included in: Data Representation Powerpoint
Intro to Statistics
This presentation covers applications of statistics, measures of central tendency (mean, median mode), quartiles, measures of dispersion (range, standard deviation), outliers, percentiles, intro the to Central Limit Theorem, the normal distribution, (bell-shaped curves), sample vs. population.Slides are animated and will walk through solving problems.Best taught over 2-3 lessons.
Subjects:
Grades:
7th - 12th, Higher Education, Adult Education
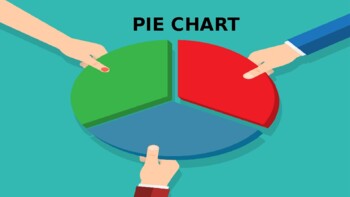
Pie Chart Powerpoint
The presentation contains:Learning Objectives.Definition of a Pie Chart.Tips for construction of pie chart.Steps to construct a pie chart with an example.Scaling and drawing a pie chart.Read and Interpret a pie chart.
Subjects:
Grades:
5th - 10th, Staff
Also included in: Data Representation Powerpoint
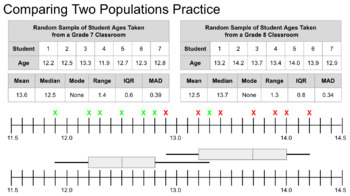
Grade 7 Statistics and Probability (Common Core/AERO) Presentations
This Bundle includes three Google Slide presentations.Each presentation addresses one of the Common Core/AERO standards for Grade 7 math in the domain of Statistics and Probability. Collectively, these presentations cover all grade 7 standards for statistics and probability as well as some of the 6th grade standards as review/scaffolding. The presentations were designed for these standards, but the content can be easily adapted to other courses.These presentations can be used to lecture but incl
Subjects:
Grades:
7th
Line Graph Powerpoint
The presentation contains:Learning objectives.Definition of a line graph.Parts of a line graph.Tips for construction of line graph.Steps to construct line graph with an example.Reading and Interpreting a line graph.Advantage of line graph.
Subjects:
Grades:
5th - 10th, Staff
Also included in: Data Representation Powerpoint
Middle Grades Math PPT Presentation - Types of Data
Types of Data is a PowerPoint lecture designed for middle grades math classes. This presentation introduces the concept of data in statistical terms, while exploring the difference between numerical and categorical data.
Subjects:
Grades:
6th - 8th
Do You Have ESP? "Experiment" for critical thinking or statistics
Fun demonstration/experiment to demonstrate probability and inject some critical thinking about paranormal phenomena into any classroom. Includes instructor notes in the notes section. This experiment involves predicting which of five "cards" will appear 25 times. The cards are fixed rather than random due to technical limitations, but the experiment repeats twice with different cards so that you may repeat it in the same classroom. The first run of this experiment is included in my lecture "Sta
Subjects:
Grades:
4th - 12th, Higher Education, Adult Education, Staff
Types:
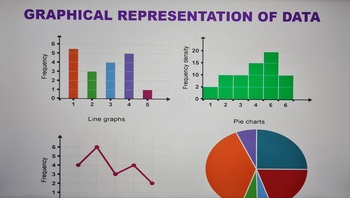
Graphical Representation of Data Powerpoint
The presentation contains the follows:1) BAR GRAPH Learning objectives. Definition of a bar graph. Parts of a bar graph. Tips for construction of bar graph. Steps to construct bar graph with an example. Types of bar graph. Advantages of bar graph. 2) DOUBLE BAR GRAPH Learning Objectives. Definition of a double bar graph. Parts of a double bar graph. Difference between bar graph and double bar graph. Tips for construction of double bar graph. Steps to construct double bar graph wit
Subjects:
Grades:
5th - 9th, Staff
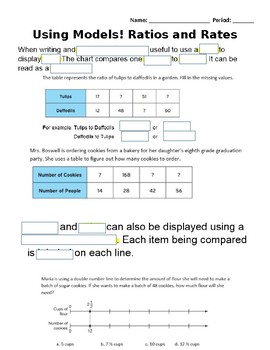
Using Models to Represent Ratios, Rates and Unit Rates Scaffold Notes
Students will use these fill in the blank notes to guide them through the Smartboard lesson on Models for ratios, rates and unit rates (located in store). Each page of the lesson is a screen shot with missing words. Students will fill in the blank and answer practice problems on handout. There is a lot an answer doc with the missing words filled in for any students with accommodations.
Subjects:
Grades:
5th - 7th
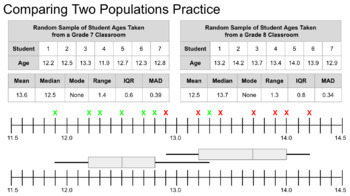
Statistics and Probability All 7.SP.B Standards Presentation (Common Core/AERO)
This is Google Slides presentation was designed to address all of the Grade 7 Math Common Core/AERO standards for 7.SP.A but the content is not at all specific to this course and can be easily adapted to other courses.In the name of scaffolding, several skills and standards from the Grade 6 curriculum are retaught in this presentation in order to give lower-level students a chance to catch up.This presentation covers:6.SP.A.2Understand that a set of data collected to answer a statistical questio
Subjects:
Grades:
7th
Also included in: Grade 7 Statistics and Probability (Common Core/AERO) Presentations
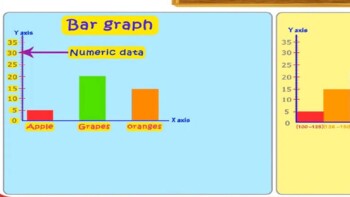
Bar Graph Powerpoint
The presentation contains:Learning objectives.Definition of a bar graph.Parts of a bar graph.Tips for construction of bar graph.Steps to construct bar graph with an example.Types of bar graph.Advantages of bar graph.
Subjects:
Grades:
6th - 9th, Higher Education, Staff
Also included in: Data Representation Powerpoint

Tally Marks Powerpoint
The presentation contains:Learning Objectives.Definition of a tally mark.Uses of tally mark.How to count a tally mark.Tally Mark Chart.Construction of a tally mark table with an example.Application on real life problems on tally mark.Read and Interpret a tally mark table.
Subjects:
Grades:
4th - 7th, Staff
Also included in: Data Representation Powerpoint
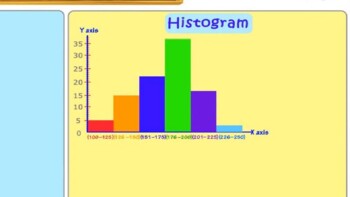
Histogram Powerpoint
The presentation contains:Learning Objectives.Definition of a Histogram.Parts of a histogram.Difference Between bar graph and histogram.Types of intervals.Tips for construction of bar graph.Steps to construct bar graph with an example.Read and Interpret a histogram.
Subjects:
Grades:
7th - 11th, Staff
Also included in: Data Representation Powerpoint
Middle Grades Math PPT Presentation - Stem and Leaf Plots
This simple PowerPoint presentation investigates stem-and-leaf plots, their construction, and their purpose. In addition, there is an active link to a stem-and-leaf plot activity at the end of the lecture.
Subjects:
Grades:
6th - 8th
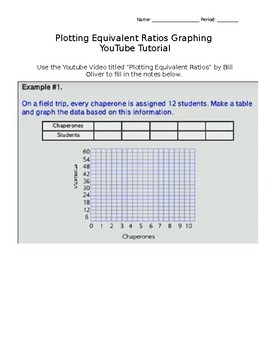
Free Online Plotting Equivalent Ratios Video - Scaffold Notes
Using the free online YouTube video lecture by Bill Oliver, "Plotting Equivalent Ratios" students will complete two examples (tables and graphs) to demonstrate understanding of graphing ratios. These examples are taken directly from the video with space for students to complete at Bill walks through each example. Students should write all the notes that the instructor writes for each example. The video is a little over 8 minutes long but with pausing for instruction and explaining along with all
Subjects:
Grades:
5th - 7th
Types:
Data Handling Powerpoint
The presentation contains:Statistics.Fundamental Characteristics of Data.Raw data.Types of Data.Data Handling Cycle.Data Tabulation/ Recording of data .Array with example.Organisation of data.Types of statistical data.Tables e.g. Tally chart / Frequency Distribution Table.Pictures e.g. Pictogram.Graphs e.g. Bar graph, Pie chart, Line graph,Diagrams e.g. Tree diagram, Venn diagram, Mapping or Arrow diagram.Using ICT in data handling.
Subjects:
Grades:
5th - 10th, Staff
Also included in: Data Representation Powerpoint
Mean, Median, Mode and Range Powerpoint
The presentation contains:Central Tendency.Importance of Central Tendency.Types of measures of central tendency.Mean and its examples.Range and its examples.Median and its examples.Mode and its examples.
Subjects:
Grades:
5th - 10th, Staff
Also included in: Data Representation Powerpoint
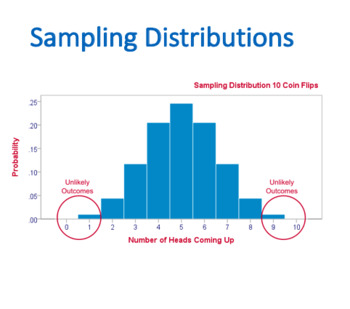
Sampling Distributions (Statistics)
Sampling Distributions is a lecture which is covered within the Statistic or Basic Business Statistic module by business and economics students.In many applications, you want to make inferences that are based on statistics calculated from samples to estimate the values of population parameters. In this lecture, you will learn about how the sample mean (a statistic) is used to estimate the population mean (a parameter) and how the sample proportion (a statistic) is used to estimate the population
Subjects:
Grades:
5th - 12th, Higher Education, Adult Education, Staff
Also included in: Statistics Module Bundle
Frequency Distribution Table Powerpoint
Objective: The student will be able to organize the given data to a meaningful and understandable.The presentation contains:Definition of a Frequency Distribution Table. Types of Frequency Distribution Table: a) Discrete Frequency Distribution Table (Ungrouped).b) Continuous Frequency Distribution Table (Grouped). Uses of Frequency Distribution Data.5 steps to construct a Frequency Distribution Table with one example on ungrouped data and two examples on grouped data.Steps include how to
Subjects:
Grades:
5th - 8th, Staff
Also included in: Data Representation Powerpoint
Showing 1-24 of 47 results


