190 results
7th grade statistics assessment microsofts
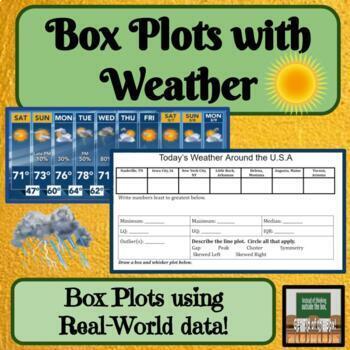
Box and Whisker Plots Real World Math Middle School Math
About this Resource:Students use current weather data from all over to create box plots using measures of variation. This is a create way to tie in some live science data! Topic Covered:*Measures of Variation/Variability*Describing Graphs*Box Plots / Box-and-Whisker Plots Ways to use this product in your classroom:-project-assessment-independent or partner work✓ Teacher Tested✓ Student Approved*This product has been used in my classroom and enjoyed by my students!Other products with similar con
Subjects:
Grades:
6th - 8th
Types:
Also included in: Box and Whisker Plots Line Plots Measures of Center Bundle Activities
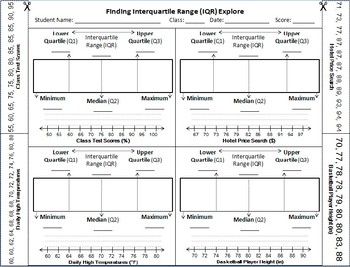
Finding and Comparing Interquartile Range (IQR)
This activity is designed for Texas TEKS listed below. Students use strips of data to fold into 'quartiles' and calculate the IQR.
represent numeric data graphically, including dot plots, stem-and-leaf plots, histograms, and box plots.[6.12A]
interpret numeric data summarized in dot plots, stem-and-leaf plots, histograms, and box plots.[6.13A]
compare two groups of numeric data using comparative dot plots or box plots by comparing their shapes, centers, and spreads.[7.12A]
Subjects:
Grades:
6th - 8th
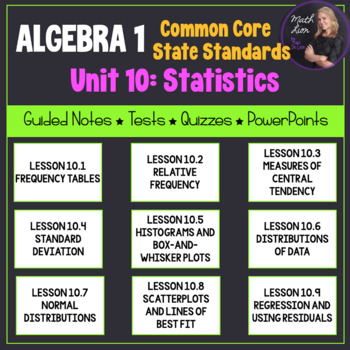
Statistics (Algebra 1 Curriculum - Unit 10) | Bundle for Common Core
This is a great unit that covers a Statistics unit in an Algebra 1 course! 9 lessons are included!All documents are EDITABLE!Included:- Overview of the common core alignment (PDF)- Guided notes for 9 lessons (PDF and Word)- PowerPoints that coordinate with the guided notes (PPTX)- Mid-Unit Quiz (PDF and Word)- Unit Test (PDF and Word)-Pacing Guide (PDF and Word)Each lesson contains a learning scale, warm up (do-now or bell ringer), key concepts, vocabulary, and examples for students to follow w
Subjects:
Grades:
7th - 12th
CCSS:
Grade 9 Geography STRAND D: Changing Populations Unit Bundle
This STRAND D: Changing Populations Bundle is a perfect fourth unit for Grade 9 Canadian Geography and includes over 100 slides of content, one quiz, and two bonus assessment activities! The bundle includes 6 products total. Answer keys are include for all quizzes and assessments. Content includes: Population trends in Canada, Immigration Trends in Canada, and Population Characteristics!! Bonus content includes 12 Kahoot Links to use as a study tool. Play as a class or students can challenge the
Subjects:
Grades:
7th - 10th
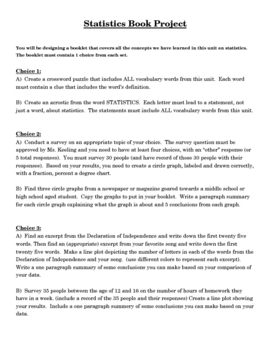
Data & Statistics Final Project
This final assessment covers topics from a data and statistics unit at the middle school level. The project covers such topics as histograms, bar graphs, circle graphs, line plots, scatter plots, misleading graphs, measures of center (mean, median, mode)and any vocabulary from the unit. The project directions give the students two choices of activities for each of the topics listed above to complete as a final assessment. For example, the section that checks for their proficiency of circle gra
Subjects:
Grades:
6th - 9th
Types:
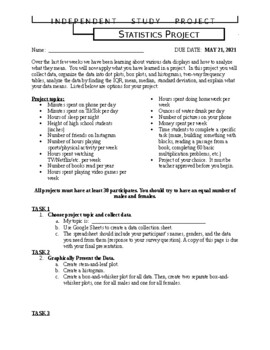
Algebra 1 - Statistics Project
Tired of doing tests? Especially by the time you get to the statistics chapter, you and your students both probably are! Here is an alternative summative assessment for you!This statistics project tasks students with conducting a survey to collect data. Then, students must graphically represent the data, analyze the data by performing statistical calculations, and interpret the data.Students really enjoy this project!!
Subjects:
Grades:
7th - 10th
Types:

Box and Whiskers Plot Weather Project
This is an engaging Data and Statistics Project that integrates math and science. Students will have an opportunity to showcase their knowledge about what they have learned from the Data and Statistics Topic and more specifically Box and Whisker Plots. This project requires students to record the weather in cities around the world and the U.S. using weather.com, give the weather forecast for a specific world and U.S. city, create Box and Whisker Plots with 5-Number Summaries, and make an iMovie
Subjects:
Grades:
6th - 8th
Types:
NGSS:
MS-ESS2-5

Math 8 Unit 19 Fractions, Percents, and Statistics
These editable lessons and PDF worksheets were written by Alex Benn using the concepts described in his book Tenacious-Teaching: Uniting Our Superpowers to Save Our Classrooms and on his website: Tenacious-Teaching.com. They include an introductory warm-up designed to remediate the required prerequisite knowledge; concise notes; tasks that require escalating effort; numerous examples to prevent misconceptions; and in-class practice problems to promote mastery. The homework problems are ordered f
Subjects:
Grades:
7th - 9th
Types:
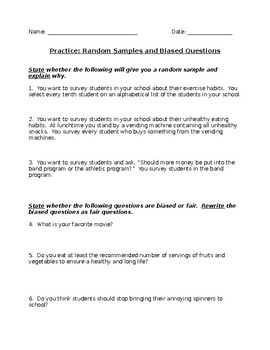
Random Samples and Biased Questions
This is a great formative assessment in a statistics unit for a lesson on random samples and bias in surveys. It could be a classwork assignment, exit ticket, or homework worksheet!
Worksheet and Answer Key included!
Subjects:
Grades:
5th - 8th
Types:
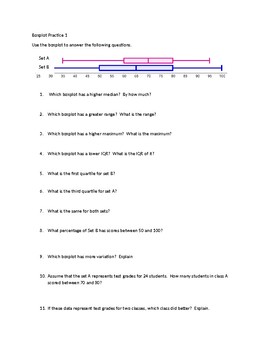
Boxplot Practice
This contains 5 boxplot worksheets analyzing, comparing and describing two boxplots. There are 3 easier ones and 2 that are more advanced. Students will have to identify and compare median, range, IQR, quartiles, minimum and maximum. They will interpret which has more variation and be able to interpret which set of scores is better. The worksheets are created in Word and the questions are fully editable. The first three can be used in middle school math or Algebra I. The 2 that are more ad
Subjects:
Grades:
6th - 12th
Types:
CCSS:

Water Balloon Catcher Project - Data and Graphing - Mathematics
Transform your maths classroom into a dynamic hub of learning with this captivating data and graphing project! Designed for upper primary/middle school students, this hands-on and inquiry-based activity ensures an immersive experience in mastering data interpretation, chart creation, and understanding the role of data and graphs in advertising.In this engaging project, students will: Explore Data: Collaborate in teams to design and construct a Water Balloon Catcher using recycled materials, each
Subjects:
Grades:
5th - 9th
Types:
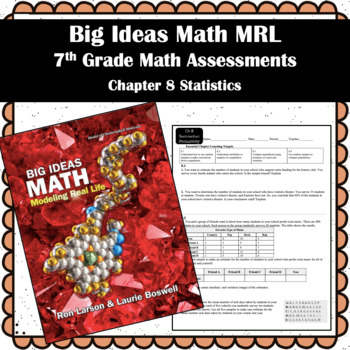
Big Ideas Math MRL- 7th Grade Assessments Chapter 8 Statistics
Big Ideas Math MRL- 7th Grade Assessments Chapter 8 StatisticsThis product is designed using the Big Ideas Math Curriculum- Modeling Real Life 7th Grade. These are assessments that align with the lessons for the unit. If you would like an editable verion of the files, please send me an email after your purchase. Included:★ 2 Different Formative Assessments & Reflections - 8.1 - 8.2 Formative & Refelction (4 Questions) - 8.3 - 8.4 Formative & Refelction (4 Questions)★ Chapter 8
Subjects:
Grades:
6th - 8th
Types:
Also included in: Big Ideas Math MRL-7th Grade BUNDLE (Assessments & Guided Notes)
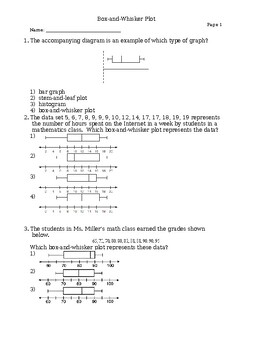
Data Analysis Mastery: Box-and-Whisker Plot Quiz with Ansers
Empower your students' data analysis skills with our Box-and-Whisker Plot Quiz! This quiz covers various graph types and challenges students to interpret and construct box-and-whisker plots. With real-world scenarios and differentiated questions, it's perfect for middle and high school math classes. Answer key included for easy grading. Enhance your students' understanding of data representation today!Leave a positive review and follow our store for more engaging math resources!
Subjects:
Grades:
6th - 8th
Types:
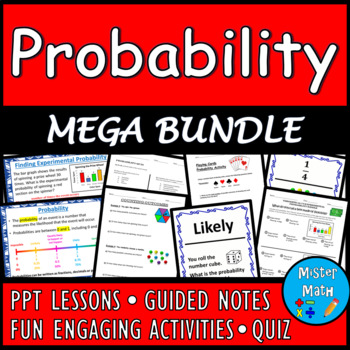
Probability MEGA BUNDLE
This Probability MEGA BUNDLE is just what you've been looking for to assist students in learning about likelihood, simple probability, and experimental/theoretical probability! Included in this bundle, you will find:Outcomes & Events PowerPoint LessonOutcomes & Events Guided Notes (coincides with PowerPoint Lesson)Simple Probability PowerPoint LessonSimple Probability Guided Notes (coincides with PowerPoint Lesson)Simple Probability Riddle ActivitySimple Probability Scavenger HuntTheoret
Subjects:
Grades:
6th - 9th
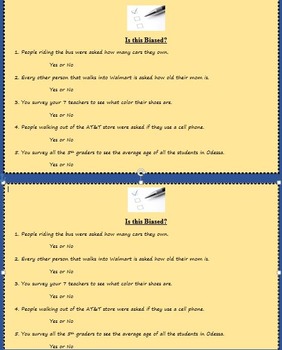
Is this Biased? (populations and random samples)
This is a 5 question quiz, exit ticket, do now, or homework assignment that reviews how surveys and samples can be biased sometimes. All 5 can be answered with a yes or no for whether it is indeed a biased survey. Enjoy and please rate and/or comment on this product!
Subjects:
Grades:
5th - 9th
Types:

Australian Football Statistics Assignment
Students are provided with a series of statistics on the ability and performance of two AFL stars.
Using this data students perform a statistical analysis determine which player is the best footballer.
There are a number of questions provided to assist students in their analysis which is completed by calculating mean, median and mode.
Students are then required to create two stem and leaf plots of the data, as well as a comparison graph.
12 questions over 3 pages.
Great to engage students in
Subjects:
Grades:
6th - 10th
Types:
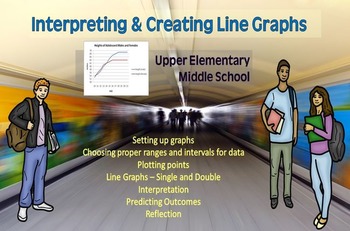
INTERPRETING AND CREATING LINE GRAPHS
Are you looking for a quick way to assess your students' mastery of double line graphs? Here it is! This can be used to practice creating double line graphs or to determine previous learning. It is ready to go! I would use it in all middle school grades maybe even lower if students are ready! This activity could also be changed to practice double bar graphs, if you want to extend the learning. It could also be used for substitute work in upper grades. It is a great way to teach creating graphs i
Subjects:
Grades:
5th - 8th
Types:
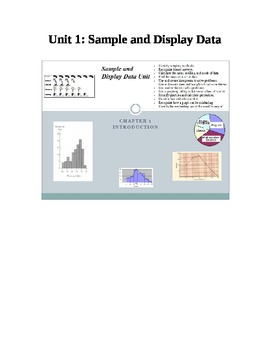
Sample and Display Data Unit
Sample and Display Data Unit
Includes learning objectives, vocabulary sheets, pre-test, test and retest.
Covers:
- Identify sampling methods.
- Recognize biased surveys.
- Calculate the mean, median, and mode of data.
- Find the range of a set of data.
- Use and create histograms to solve problems.
- Use and create stem and leaf plots to solve problems.
- Use scatter plots to solve problems
- Use a graphing utility to determine a line of best fit.
- Identify quartiles and calculate percentil
Subjects:
Grades:
5th - 12th, Higher Education, Adult Education, Staff
Types:

Mean, Median, Range, Mode Quiz
This is a five problem math quiz. It can be used for a quiz, but also as a review. There are five sets of numbers where students must find the mean, median, range, and mode of each data set. The numbers are not in numerical order.
Subjects:
Grades:
3rd - 8th
Types:
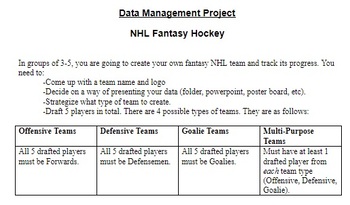
Data Management project - NHL Fantasy Hockey
This is an ongoing project that will take about 3-4 weeks to complete as it requires 10 days of data collection. Students draft a fantasy hockey team of 5 players and then they need to track certain stats, and then table and graph the results in a variety of formats. They then write a newspaper article reviewing their team's success, or lack thereof, while also looking at bias. Can be modified easily for higher or lower grades by changing the types of graphs and data used.
Subjects:
Grades:
6th - 10th
Types:
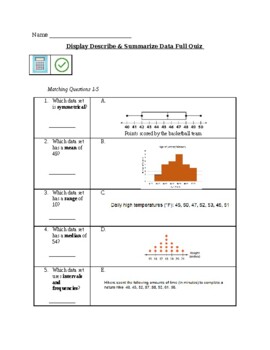
Display Describe & Summarize Data Full 15 Question Multiple Choice Quiz
Display Describe & Summarize Data Full 15 Question Multiple Choice QuizStatistical Questions, Mean, Median, Mode, Range, Dot Plots, Frequency Tables, Box Plots, Histograms, M.A.D., IQR, Measures of Center & Variation, Vocabulary including - Symmetrical, Cluster, Outlier, Skewed & Degrees of a circle
Subjects:
Grades:
5th - 9th
Types:
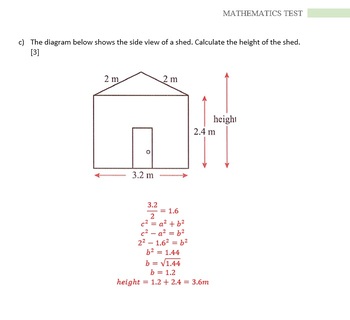
Mathematics Test for Grade 8 - Pythagoras, Congruency, Similarilty & Stats
Are you looking for great tests but don't have the time to create it?Then you've come to the right place! This is a straight forward test on Theorem of Pythagoras, Congruency, Similar triangles, Mean Median Mode Quartiles, & Factorization. Yet this test is still engaging and colorful.This test contains the questions as well as answers (in red). To create the question paper, simply delete the answers in red. This test is out of 47 marks. It can be used as a Summative Assessment or Formative A
Subjects:
Grades:
7th - 9th
Types:
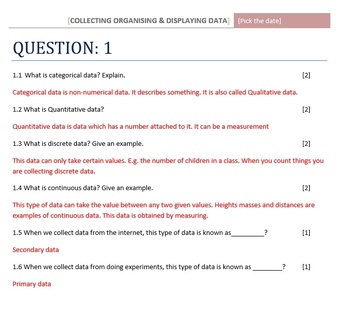
Mathematics Test on Statistics
Are you looking for great tests but don't have the time to create it?Then you've come to the right place!This is a straight forward test on Statistics. This test covers general terminology on statistics, Tally tables, Line Graphs and general understanding of data. Yet this test is still engaging and colorful.This test contains the questions as well as answers (in red). To create the question paper, simply delete the answers in red. This test is out of 37 marks. It can be used as a Summative Asse
Subjects:
Grades:
7th - 9th
Types:
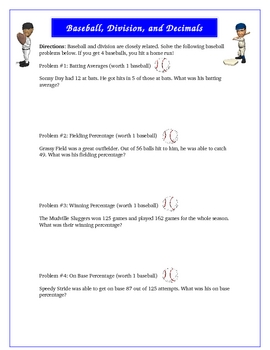
Baseball Division and Decimals Math Activity Game
Baseball Division and Decimals Math Activity Game. Do you want to teach division and decimals in a fun way? This one page worksheet, and one page answer key will have your students figure out batting averages, fielding percentage, on base percentage, and winning percentage about ficticious and fun characters. For each problem correct, they will get a baseball. If they get all four problems (baseballs), they will hit a home run! Get your students excitement level up with this creative activity.
Subjects:
Grades:
5th - 7th
Types:
Showing 1-24 of 190 results


