145 results
7th grade statistics handout microsofts
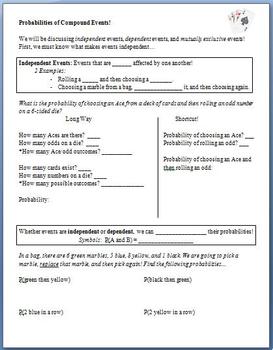
Probability of Compound Events (Guided Notes)
This lesson is meant to be used as guided notes for a whole class.
Students begin by learning what makes 2 events independent. After slowly working through a problem about rolling a die and choosing a card, they discover that they can multiply probabilities when working with these compound events. They then attempt problems involving picking marbles from a bag. Next, they learn about dependent events, and finally, mutually exclusive events.
The last 2 pages are a copy of the key.
Subjects:
Grades:
6th - 12th
Types:
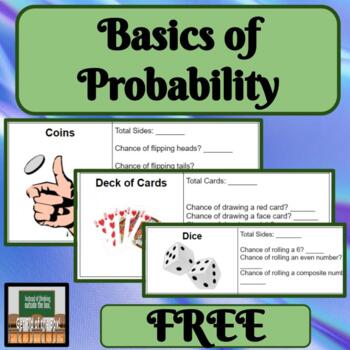
Basics of Probability Dice Cards Coins
About this Resource:Many students do not know all that is needed about dice, coins, and decks of cards. In order to be successful, it is important to cover all of this information first. Topic Covered:*Probability Ways to use this product in your classroom:-whole class-exploration-hands-on-small group-independent Other products with similar content.M&M's ProbabilityBox Plots with WeatherVisuals with Measures of Central TendencyCreating Line Plots
Subjects:
Grades:
6th - 9th
Types:
Also included in: Probability Bundle Hands On Dice Cards Coins Simple Probability
Psychology Random Sample Population Stats M&M Worksheet for Research Methods
Psychology or Statistics Random Sample & Population Statistics M&Ms Worksheet Activity for Research Methods includes a teacher direction sheet with materials that you need and how to complete the activity along with printable handout for students. *Student Favored activity*Please email me with any questions at ReadySetLearnSocialScience@yahoo.comIf you would like to get updates on NEW and CURRENT resources...►FOLLOW Me on Teachers Pay Teachers►FOLLOW Me on Pinterest►FOLLOW Me on Instagr
Subjects:
Grades:
4th - 12th, Adult Education
Types:
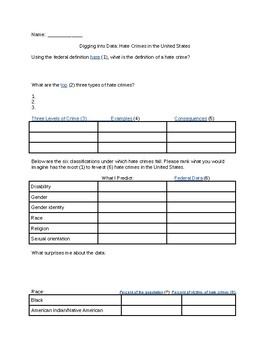
The 57 Bus- Looking at Hate Crime Data
A guided web search on hate crime data from the FBI, CDC, Pew Research Center, and U.S. Census Bureau. Uses reflection questions to make conclusions and predictions about the distribution of hate crimes. The kids are fascinated by the data!
Subjects:
Grades:
7th - 12th, Higher Education, Adult Education
Types:
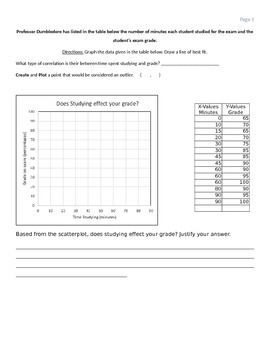
Scatter plot worksheet (Positive Correlation)
In this worksheet, the students are given a scenario and table of data points. The students must plot the points, draw a line of best fit, create & plot a possible outlier data point. Also, there is a short writing portion where students must reflect and write about the scatter plot scenario.
Subjects:
Grades:
6th - 9th
Types:
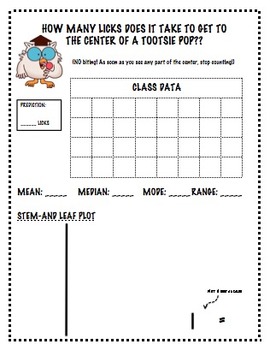
Tootsie Pop Activity w/ MMM, Stem and Leaf, Frequency Tables and Histograms
I would recommend using mini-Tootsie Pops so it doesn't take the kids forever to get to the center. I had them stop as soon as they saw any part of the center.
This activity gather data as a class and then students use the data to create a stem and leaf plot, frequency table and histogram. Student will also find mean, median, mode and range.
See my free download, "Tootsie Pop PowerPoint for a hook to get the kids started on this activity :-)
Subjects:
Grades:
6th - 8th
Types:
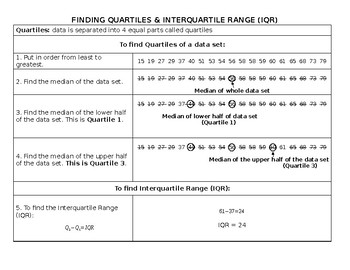
Finding Quartiles & Interquartile Range Notes
This easy-to-read, easy-to-follow handout helps kids remember how to find quartiles and Interquartile Range (IQR).
Subjects:
Grades:
5th - 8th
Types:
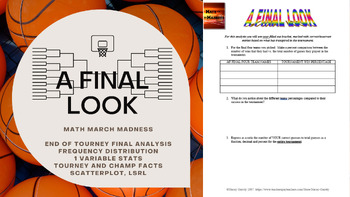
Math March Madness - A Final Look (Freq Distributions, Stats, Regression Lines)
Fill out a bracket, watch the tournament unfold and then mathematically analyze how you did! This activity is flexible enough to be used for a variety of levels. I have used all 6 pages for an AP Statistics class, and have used pages 1 through 5 for an Algebra or Algebra 2 class. You could even use it in lower levels as long as you are covering percents, and basic stats like mean, median, mode and graphing. The document is editable so you can adjust/delete to tailor to the level of statistic
Subjects:
Grades:
4th - 12th, Higher Education
Types:
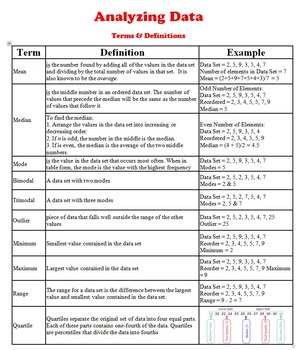
Data Analysis - Terms & Definitions (statistical measures definitions)
This Handout is part of : Maze - BUNDLE Statistical Measures (Mean, Median, Mode, & Range)
This handout is a quick reference sheet which includes the main definitions needed to introduce the data analysis terms in statistics. Terms such as: mean, median, mode, bimodal, outlier, minimum, range, quartile, box-and-whisker,.... etc. are some of the definitions shared on this handout.
Share it with your students, test them on it, and expect them to know it by heart. Those definitions are the
Subjects:
Grades:
6th - 12th, Higher Education, Adult Education
Types:
White Bear Experiment: Students Conduct a Consciousness Experiment
My students like this quick and easy experiment. They replicate the famous "White Bear Experiment" on classmates or with others who volunteer for the study. They then chart their results. There is then a reading discussing people controlling their consciousness with a spot for students to reflect on the information.I use this for my psychology course when we discuss consciousness. There is no key for this as answers will vary depending on the results of their experiment.This experiment can s
Grades:
7th - 12th
Types:
Also included in: Psychology Curriculum Custom Bundle
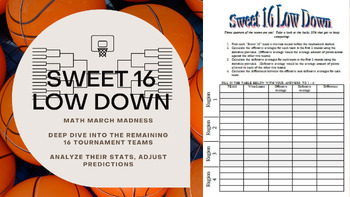
Math March Madness - Sweet 16 Low Down (Statistics Analysis of Final 16 Teams)
Join in the fun of the NCAA tournament at the Sweet 16 round! In this activity students analyze win percentages of the remaining 16 teams as well as research and compute their average offense and defense. This editable activity also asks students to analyze math presented in the real world by finding media and articles that use statistics to further their arguments.This can be used independently or check out these other items in my store for a comprehensive March Madness Project!Math March Mad
Subjects:
Grades:
4th - 12th, Higher Education
Types:
CCSS:
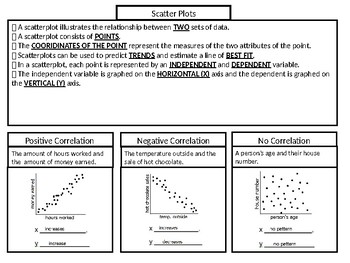
Scatter Plot Notes SOL 8.13
SOL 8.13 The student will a) represent data in scatterplots; b) make observations about data represented in scatterplots; and c) use a drawing to estimate the line of best fit for data represented in a scatterplot.
Subjects:
Grades:
6th - 8th
Under the Boardwalk: The Monopoly Story (Amazon Prime)
This simple video guide accompanies the documentary film "Under the Boardwalk: The Monopoly Story" (Amazon Prime) which details the history of the game and the social phenomenon it has become, all against the backdrop of the 2009 World Championships. This guide will help students engage with the film and stay on task throughout the presentation. Answer key included with timestamps.
Grades:
5th - 12th
Types:
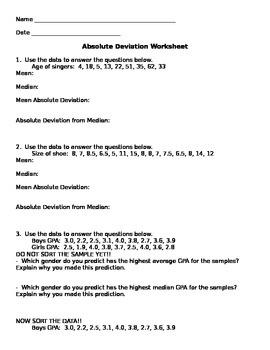
Mean Absolute Deviation Worksheet
Students will practice finding measures of central tendency and then calculate the mean absolute deviation as well as the absolute deviation from the median.
Subjects:
Grades:
6th - 10th
Types:
CCSS:
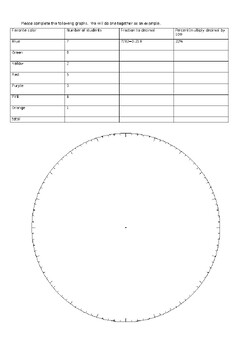
Making pie charts
This activity is practice making pie charts. The pie chart that is included has 100 marks to make it perfect for using percents to create pie charts. The last page is the students creating their own question and surveying the class to create their own pie chart. Students need to know how to convert between fractions, decimals and percents.
Subjects:
Grades:
5th - 8th
Types:
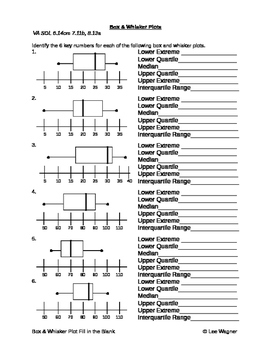
BOX & WHISKER PLOT FILL IN THE BLANK
Fill in the blank worksheet. Box & Whisker plots (extremes, quartiles, median, outliers, and percentages).
Subjects:
Grades:
6th - 8th
Types:
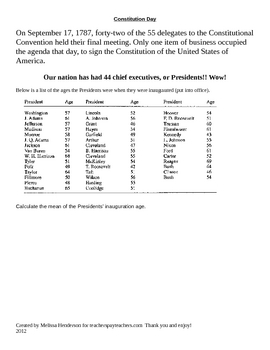
Constitution Day - Math activity
Constitution Day. It is a law that all teachers must teacher the constitution on this day regardless of the content. I developed this activity for my 6th grade students to complete on constitution day. This would also be a great cross curriculum item as well!
Subjects:
Grades:
5th - 7th
Types:
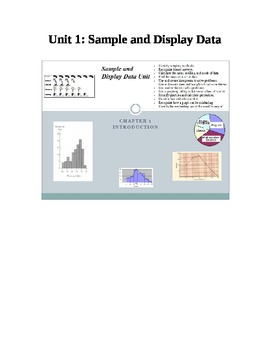
Sample and Display Data Unit
Sample and Display Data Unit
Includes learning objectives, vocabulary sheets, pre-test, test and retest.
Covers:
- Identify sampling methods.
- Recognize biased surveys.
- Calculate the mean, median, and mode of data.
- Find the range of a set of data.
- Use and create histograms to solve problems.
- Use and create stem and leaf plots to solve problems.
- Use scatter plots to solve problems
- Use a graphing utility to determine a line of best fit.
- Identify quartiles and calculate percentil
Subjects:
Grades:
5th - 12th, Higher Education, Adult Education, Staff
Types:
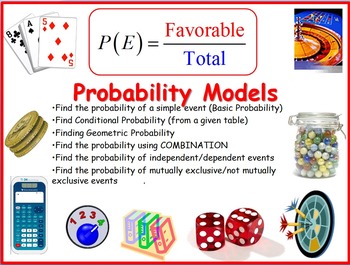
Probability Models
This handout drills the understanding of the different models of probability. Student would have to first determine under which model should this problem fit, then, apply the appropriate strategy to answer the questions. There are many ways to answer each of the questions provided in this handout. I provided "An" answer key.
In this handout, you will find a set of 40 questions on the following probability models:
1. Detailed visual description of the Standard Deck of Cards
2. Basic Probab
Subjects:
Grades:
6th - 12th, Higher Education, Adult Education, Staff
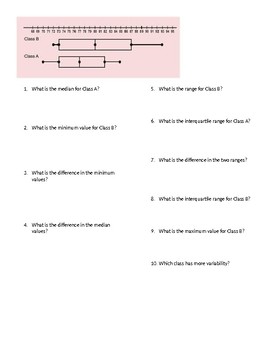
Double Box and Whisker Plot Worksheet
double box and whisker plot worksheet including median, Q1, Q3, IQR, range, and variability
aligned to 7th grade NC common core state standards
Subjects:
Grades:
6th - 8th
Types:
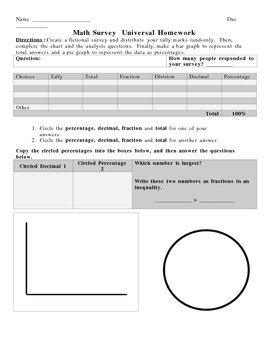
Take A Survey -- Learn Fractions, Percents and Decimals
This is a project that helps students learn to compute fractions, decimals and percents. The preview is a "universal" homework that students can complete for review any time during the year.
Take A Survey -- Learn Fractions, Percents and Decimals by Sherre Vernon is licensed under a Creative Commons Attribution-Share Alike 3.0 United States License.
Subjects:
Grades:
6th - 12th, Higher Education, Adult Education
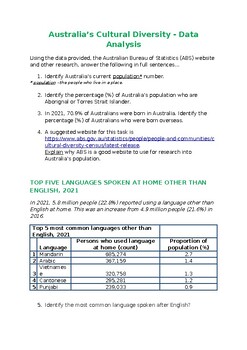
Australia's Cultural Diversity Data Analysis
Australia's Cultural Diversity Data AnalysisThis resource involves students examining a variety of graphs showing ABS data related to Australia's diversity, and answering the accompanying structured questions.Curriculum LinksVictorian CurriculumIntercultural CapabilityYear 9/10 History – The Globalising World (Migration Experiences)o Effects of significant post-World War II world events and developments on one major global influence that shaped change in Australian society (VCHHK157)o Causes and
Subjects:
Grades:
7th - 10th
Types:
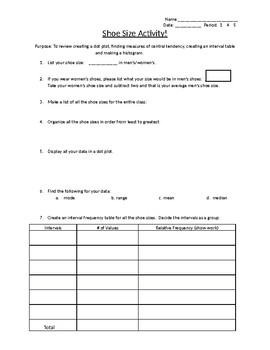
Shoe size group activity! Review dot plots and histograms.
This activity was created as a review for creating a dot plot, finding measures of central tendency, creating an interval table and making a histogram. All these items are covered in this group activity for your class! Kids enjoy working together while reviewing and learning all at one time.This is a word document that you change change anyway to fit your classes needs.
Subjects:
Grades:
3rd - 12th
Types:
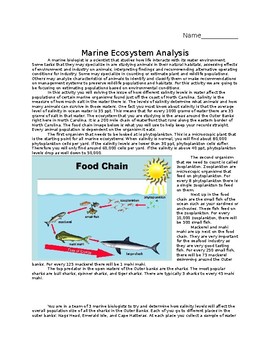
Marine Biology Ecosystem Math Project
Students will use ratios to determine a population of sharks in the Outer Banks. This requires them to follow directions and find clues from a reading text and use of a picture to eventually come up with a end population.This is a wonderful activity for a dual curriculum project between science and math.
Subjects:
Grades:
7th - 8th
Showing 1-24 of 145 results


