119 results
7th grade statistics printable microsofts
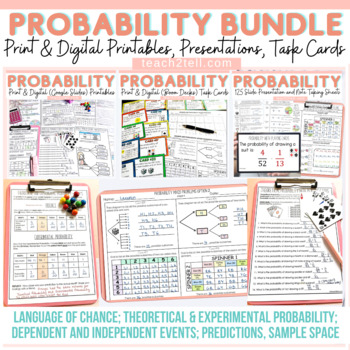
Chance and Probability Activities Theoretical & Experimental Probability Bundle
Are you teaching your students all about chance and probability and looking for fun hands-on probability activities? This print and digital bundle of worksheets, task cards, slideshows and note-taking sheets on Probability will reinforce the understanding of theoretical probability, experimental probability, language of chance, sample space, predictions, lists, tree diagrams, dependent probability events and independent probability events.Both US and British English spelling and terminology file
Subjects:
Grades:
4th - 7th
Geometry: Survey and Circle Graph Project Made Fun!
Circle Graph Geometry Activity - Everyone just wants their piece of the pie!This is a fun, multi-faceted project that will have your students creating and implementing a survey, converting their results using various mathematical operations, and creating a poster-sized circle graph incorporating various geometry skills.This Survey and Circle Graph Project Unit Includes:PowerPoint:-Fun, interactive, 3-part PowerPoint slide presentation that walks you and your students through the entire project f
Subjects:
Grades:
5th - 7th
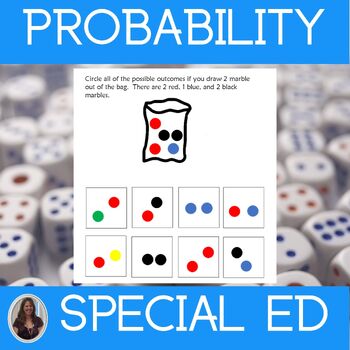
Chance & Probability Math Worksheets Special Education Statistics & Probability
This unit on Chance and Probability contains printable and digital math worksheets for special education. This statistics and probability unit is for students who take alternate assessments.This Chance and Probability unit helps students understand how to determine the probability of an event and all its possible outcomes. The worksheets, which use pictures and color coding, are differentiated. There are many ways for students to practice these skills in this unit that are at different levels.
Subjects:
Grades:
7th - 9th
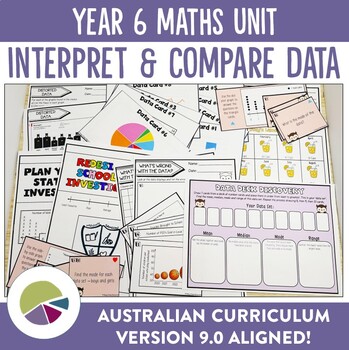
Australian Curriculum 9.0 Year 6 Maths Unit Data
Help your students complete statistical investigations with this unit plan and activity bundle. Bring your maths lessons to life as the unit plan walks you through everything you need to thoroughly cover the AC9M6ST01, AC9M6ST02 and AC9M6ST03 elements of the Australian Year 6 Maths curriculum (version 9.0). Fun for students, easy for you to implement and an irresistible way to help budding mathematicians learn how to use statistics!Bring the fun back into using data as you guide your students th
Subjects:
Grades:
5th - 7th
Also included in: Ultimate Australian Curriculum 9.0 Year 6 Units Bundle

Safe Cracker - Mean, Median, Mode, & Outliers - Math Fun!
Do your students get excited when you tell them it's time to study outliers and measures of center? Of course they don't.
But they will if you use this fun, Safe Cracker worksheet!
Students can become world famous safe crackers! Your students will use the clues and their math skills to help crack the safes, in order to claim the prizes found inside.
Students are given three "clues", which involve outliers and measures of center (mean, median, and mode). The answers become the numbers in the
Subjects:
Grades:
5th - 8th
Types:
CCSS:
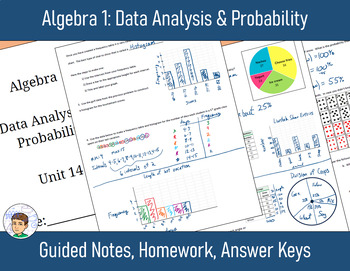
Algebra 1 Unit 14: Data Analysis & Probability - Notes, Homework, Answers
This unit is a great resource for any math course looking to add a supplementary unit on Data Analysis and Probability. You are buying guided notes, notes keys, homework assignments, and answers for a 6 lesson unit. This unit is based on a traditional Algebra 1 curriculum.Please check out the preview file to see what the unit will look like.This Word document makes it easy for you to modify, edit, or copy and paste to make your own reviews and tests for the unit.Topics covered in this unit are:R
Subjects:
Grades:
7th - 10th
Types:
Psychology Random Sample Population Stats M&M Worksheet for Research Methods
Psychology or Statistics Random Sample & Population Statistics M&Ms Worksheet Activity for Research Methods includes a teacher direction sheet with materials that you need and how to complete the activity along with printable handout for students. *Student Favored activity*Please email me with any questions at ReadySetLearnSocialScience@yahoo.comIf you would like to get updates on NEW and CURRENT resources...►FOLLOW Me on Teachers Pay Teachers►FOLLOW Me on Pinterest►FOLLOW Me on Instagr
Subjects:
Grades:
4th - 12th, Adult Education
Types:
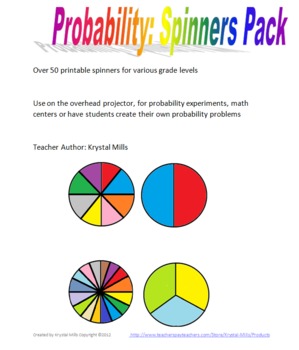
Probability Spinners Pack
This resource includes spinners for probability problems and experiments that could be used in various grades.
Included:
-blank spinners (2,3,4,5,6,8,10 and 16 spaces)
-numbered spinners (2,3,4,5,6,8, and 10 spaces)
-printable sheets (4 spinners to a page) of blank spinners with 2,3,4,5,6,8,10 and 16 spaces
-colored spinners (2,3,4,5,6,8,10 and 16 spaces)
Over 50 spinners that can be used with various grades and for various activities. Ready to print and go!
Teacher Author: Krystal Mills
pr
Subjects:
Grades:
3rd - 8th
Types:
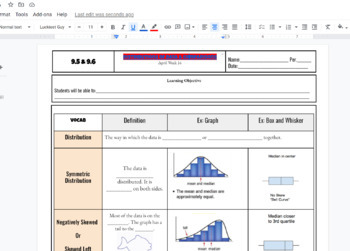
Distributions of Data Scaffolded Fillable Notes (Skewed Left & right) w/ KEY
Distributions of Data Scaffolded Fillable Notes (Skewed Left & right) Includes a problem of creating box plot, bar chart, and dot plot. KEY IS INCLUDED linked at top of title highlighted in red!!! , Algebra 1 or Math 1 class in highschool setting IEP 504 EL learners visuals for better understanding. YOU CAN EDIT THE GOOGLE DOC to your liking!!!
Subjects:
Grades:
7th - 12th, Higher Education, Adult Education
CCSS:
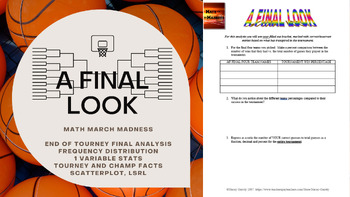
Math March Madness - A Final Look (Freq Distributions, Stats, Regression Lines)
Fill out a bracket, watch the tournament unfold and then mathematically analyze how you did! This activity is flexible enough to be used for a variety of levels. I have used all 6 pages for an AP Statistics class, and have used pages 1 through 5 for an Algebra or Algebra 2 class. You could even use it in lower levels as long as you are covering percents, and basic stats like mean, median, mode and graphing. The document is editable so you can adjust/delete to tailor to the level of statistic
Subjects:
Grades:
4th - 12th, Higher Education
Types:
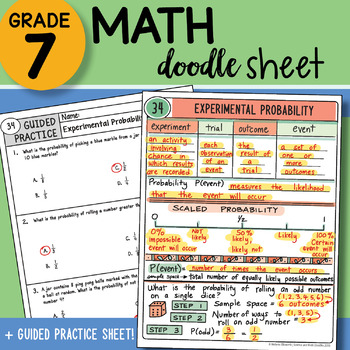
Math Doodle - Experimental Probability - Easy to Use Notes with PPT
7th Grade Math Doodle Sheet Product INCLUDES:Math Doodle Sheet - blank and keyGuided Practice Sheet - blank and keyPowerPoint – to show students the KEY– two versions of both sheets included: INB and large 8.5 x 11 size ALL TEKS Aligned– plan for the FULL year included with table of contents page for INB! SAVE BIG and buy the WHOLE YEAR SET found here:7th Grade Math Doodle Sheets ALL YEAR SET WHOLE YEAR SET List below:ALL TEKS Aligned– plan for the FULL year included! LIST of 88 Doodle Sheets p
Subjects:
Grades:
6th - 8th

Mission Series #1: Averaging
Students are placed on a mission to help the teachers of Peace University average their semester grades. They are given five teacher gradebooks and asked to find the mean for each student. Guaranteed to make learning fun and engaging! Students feel a sense of adventure as they complete this simple lesson in the form of a quest. They show their understanding of this statistic concept while they fulfill their assignment. Answer Keys included.
Subjects:
Grades:
6th - 8th, Adult Education
Types:
CCSS:
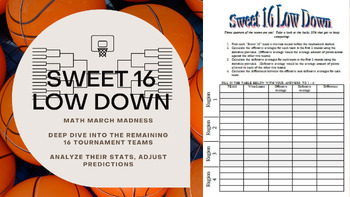
Math March Madness - Sweet 16 Low Down (Statistics Analysis of Final 16 Teams)
Join in the fun of the NCAA tournament at the Sweet 16 round! In this activity students analyze win percentages of the remaining 16 teams as well as research and compute their average offense and defense. This editable activity also asks students to analyze math presented in the real world by finding media and articles that use statistics to further their arguments.This can be used independently or check out these other items in my store for a comprehensive March Madness Project!Math March Mad
Subjects:
Grades:
4th - 12th, Higher Education
Types:
CCSS:
Under the Boardwalk: The Monopoly Story (Amazon Prime)
This simple video guide accompanies the documentary film "Under the Boardwalk: The Monopoly Story" (Amazon Prime) which details the history of the game and the social phenomenon it has become, all against the backdrop of the 2009 World Championships. This guide will help students engage with the film and stay on task throughout the presentation. Answer key included with timestamps.
Grades:
5th - 12th
Types:
Chance and data (probability) multiple choice math test
Chance and data (probability) multiple choice math testIncludes:- 24 multiple choice math questions- finding probability with dice, spinners, bar charts and colored ballsTags:chance and data, probability, multiple choice, chance with dice, chance with spinners, chance test questions, probability test, probability questions
Subjects:
Grades:
5th - 8th
Types:
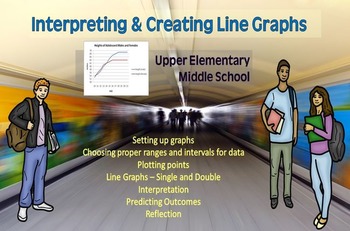
INTERPRETING AND CREATING LINE GRAPHS
Are you looking for a quick way to assess your students' mastery of double line graphs? Here it is! This can be used to practice creating double line graphs or to determine previous learning. It is ready to go! I would use it in all middle school grades maybe even lower if students are ready! This activity could also be changed to practice double bar graphs, if you want to extend the learning. It could also be used for substitute work in upper grades. It is a great way to teach creating graphs i
Subjects:
Grades:
5th - 8th
Types:
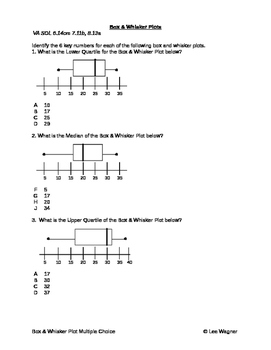
BOX & WHISKER PLOT MULTIPLE CHOICE
Box and Whisker plot multiple choice worksheet. Covers extremes, quartiles, medians, outliers, and percentages.
Subjects:
Grades:
6th - 8th
Types:
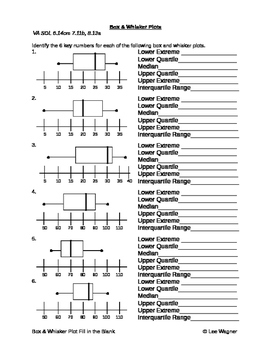
BOX & WHISKER PLOT FILL IN THE BLANK
Fill in the blank worksheet. Box & Whisker plots (extremes, quartiles, median, outliers, and percentages).
Subjects:
Grades:
6th - 8th
Types:
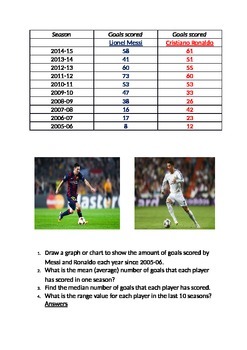
Messi v Ronaldo - mean, mode, median, range.
Data handling with a soccer twist. Find the mean, median, mode and range of the goals scored by the extraordinary Lionel Messi and Cristiano Ronaldo over the last 10 years, and create a variety of graphs and charts in the process.
Subjects:
Grades:
5th - 12th
Types:
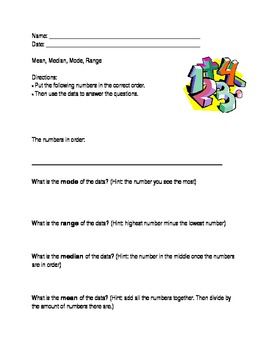
Mean, Median, Mode, Range; Modified Special Ed Math Template; Statistics
This is a modified worksheet from the middle school statistics curriculum. It is excellent for special education students who require an alternate or modified curriculum.
This worksheet allows teachers to input numbers in the blank space. This way teachers can use the template over and over with different numbers. Students are then to write the numbers in the correct order. Then, they have to find the mean, median, range, and mode. There are "hints" (formulas) that help the students differentia
Grades:
PreK - 12th
Types:
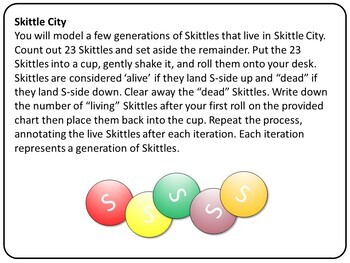
Skittle City: A Fun Mathematical Modeling game for recursion and probability
This exercise is incredibly fun! It is designed to challenge students to explore data analysis and discover about the math concepts of recursion and probability. Students break up in groups and work on modeling a notional Skittle City population. I firmly believe that experience should come before learning formal math formulas and definitions. This is a great way to get the students engaged and have them learn these concepts without even realizing it!Full instructor guide and Answer Key included
Subjects:
Grades:
3rd - 12th
Types:
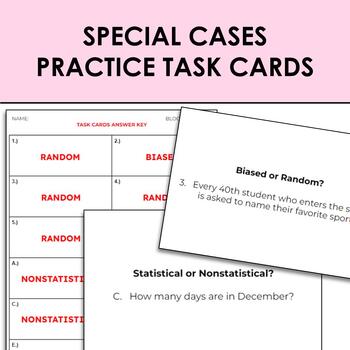
Statistical Questions and Biased vs. Random Practice Task Cards
Give your students to opportunity to practice statistical vs. non-statistical questions, and biased vs. random sampling. These task cards to hang/place around the room provide the chance for repetitive practice of deciding whether a question is statistical or non-statistical, as well as choosing whether a sampling technique is biased or random for the given population. You could even pull small groups of students while other students work on this task independently or with partners. Includes all
Subjects:
Grades:
6th - 8th
Types:
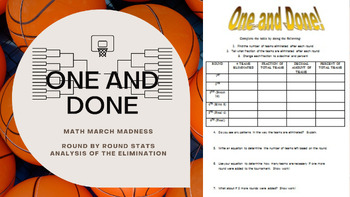
Math March Madness - One and Done! (Statistics of the Elimination Analysis)
Take a look at the "one and done" elimination element of the NCAA tournament! Students analyze probability, and write equations to describe the relationship of teams left in the tournament.This activity can be used independently during the tournament or any other time throughout the year. It can also be used in conjunction with my other March Madness activities for a comprehensive unit! Check out my store for more!Check out these other items in my store for a comprehensive March Madness Proje
Subjects:
Grades:
6th - 12th, Higher Education
Types:
CCSS:
Printable Box-and-Whisker Plot 2012 Top Movies Fun Algebra Activity
This Printable lists the 15 top grossing movies of 2012. Students are to create a Box-and-Whisker plot or boxplot of the data. Hopefully they will enjoy reminiscing about movies they have seen in the past. Since there are 15 movies, the data is very easy to work with and no averages are needed. To make the problem more complicated, just eliminate one of the movies. There is an answer key provided for the 15 movies. I hope your students have fun!
Thank you for purchasing my product. Please
Subjects:
Grades:
5th - 11th
Types:
Showing 1-24 of 119 results


