132 results
7th grade statistics center microsofts
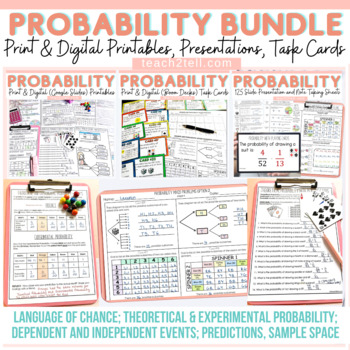
Chance and Probability Activities Theoretical & Experimental Probability Bundle
Are you teaching your students all about chance and probability and looking for fun hands-on probability activities? This print and digital bundle of worksheets, task cards, slideshows and note-taking sheets on Probability will reinforce the understanding of theoretical probability, experimental probability, language of chance, sample space, predictions, lists, tree diagrams, dependent probability events and independent probability events.Both US and British English spelling and terminology file
Subjects:
Grades:
4th - 7th
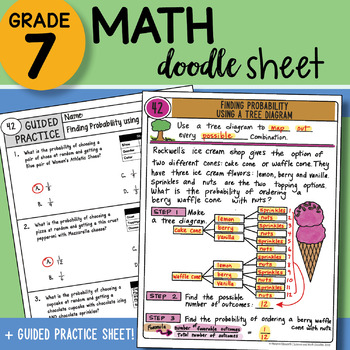
Math Doodle - Finding Probability using a Tree Diagram - Easy to Use Notes w PPT
7th Grade Math Doodle Sheet Product INCLUDES:Math Doodle Sheet - blank and keyGuided Practice Sheet - blank and keyPowerPoint – to show students the KEY– two versions of both sheets included: INB and large 8.5 x 11 size ALL TEKS Aligned– plan for the FULL year included with table of contents page for INB! SAVE BIG and buy the WHOLE YEAR SET found here:7th Grade Math Doodle Sheets ALL YEAR SET WHOLE YEAR SET List below:ALL TEKS Aligned– plan for the FULL year included! LIST of 88 Doodle Sheets p
Subjects:
Grades:
6th - 8th

Candy Probability: Discovery of EXPERIMENTAL vs. THEORETICAL Probability
Middle Schoolers LOVE probability!
This is a GREAT lesson around Halloween when the kids are already hyped up on sugar and want to 'talk' to their classmates.
This activity allows the students to DISCOVER the differences between EXPERIMENTAL and THEORETICAL probability and connect it to everyday experiences. The probability lesson lends itself to fractions, decimals, percents, data collection, rational & irrational numbers, statistical graphs (box and whiskers, frequency tables...), measu
Subjects:
Grades:
5th - 9th
Types:
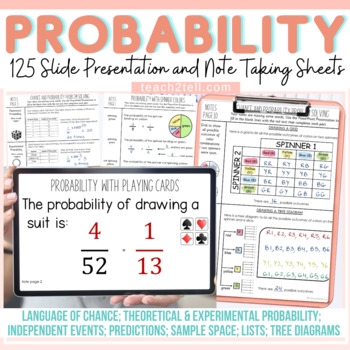
Chance and Probability Activities PowerPoint Presentations and Guided Notes
Are you teaching your students all about chance and probability and looking for fun hands-on probability activities? This Probability resource features 125 animated slides and 32 Cornell-style note-taking sheets to make abstract content on Chance and Probability more concrete.Your students will have a better understanding of theoretical probability, experimental probability, language of chance, sample space, predictions, lists, tree diagrams, and independent probability events.Both US and Britis
Subjects:
Grades:
4th - 8th
Probability project using Real-World March Madness Tournament
Jump into the March Madness tournament to apply probability concepts to a real-world application. Great for your sports-loving students. Students explore probability first by determining the probability that a team will win. Students, further, weight teams based on historical data and/or team statistics. This mini-project allows for creative problem-solving and has some open-ended answers.Included in this resource:★ Student pages for 3 March Madness related activities★ Detailed guidelines fo
Subjects:
Grades:
7th - 10th
Types:
Also included in: 7th Grade Math Resource Bundle
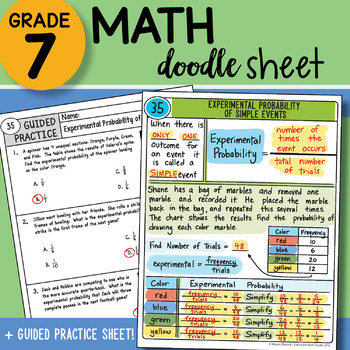
Math Doodle Sheet - Experimental Probability of Simple Events - Notes with PPT
7th Grade Math Doodle Sheet Product INCLUDES:Math Doodle Sheet - blank and keyGuided Practice Sheet - blank and keyPowerPoint – to show students the KEY– two versions of both sheets included: INB and large 8.5 x 11 size ALL TEKS Aligned– plan for the FULL year included with table of contents page for INB! SAVE BIG and buy the WHOLE YEAR SET found here:7th Grade Math Doodle Sheets ALL YEAR SET WHOLE YEAR SET List below:ALL TEKS Aligned– plan for the FULL year included! LIST of 88 Doodle Sheets p
Subjects:
Grades:
6th - 8th
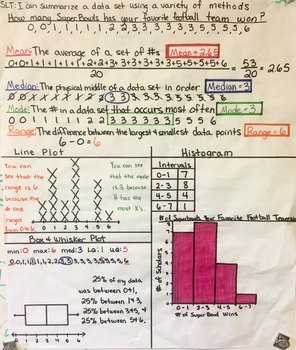
Statistics Project Line Plot Histogram Box & Whisker Measures Central Tendency
Your purchase comes with the rubric and checklist pictured above, I had scholars get their checklist signed after each part, when all signatures were collected they were given their poster paper. This project allows scholars to come up with their own statistical question, collect data from their peers, and then prepare a poster to summarize their data. The poster includes the data set, measures of central tendency (mean, median, mode, & range), line plots, histograms, box & whisker plots
Subjects:
Grades:
6th - 7th
Types:
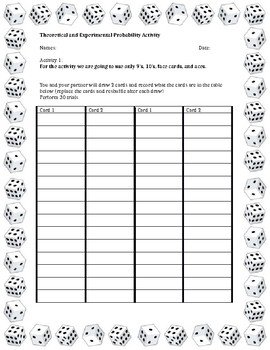
Theoretical and Experimental Probability Activity
These activities have students interact with playing cards and dice to practice with theoretical and experiment probability. Questions on the worksheet vary in difficulty.
Subjects:
Grades:
7th - 10th
Types:
CCSS:
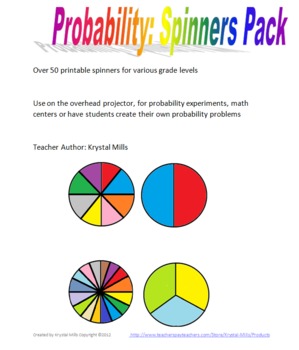
Probability Spinners Pack
This resource includes spinners for probability problems and experiments that could be used in various grades.
Included:
-blank spinners (2,3,4,5,6,8,10 and 16 spaces)
-numbered spinners (2,3,4,5,6,8, and 10 spaces)
-printable sheets (4 spinners to a page) of blank spinners with 2,3,4,5,6,8,10 and 16 spaces
-colored spinners (2,3,4,5,6,8,10 and 16 spaces)
Over 50 spinners that can be used with various grades and for various activities. Ready to print and go!
Teacher Author: Krystal Mills
pr
Subjects:
Grades:
3rd - 8th
Types:
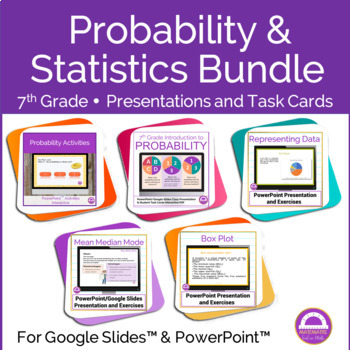
Bundle Statistics and Probability | 50% Discount
PowerPoint presentations on statistics and probalility. Perfect for an online lesson or distance learning.You can send it to your students and they'll have everything they need. If you are online with them, you can project it and comment.Or you can simply print it and give to your students.Suitable for IB MYP Middle Years ProgrammeIt includes:Mean, Mode and Median.With examples and exercises, for students to practice.This product and:Distance Learning - Mean. Mode, Median - Google Slideshttps:/
Subjects:
Grades:
6th - 9th
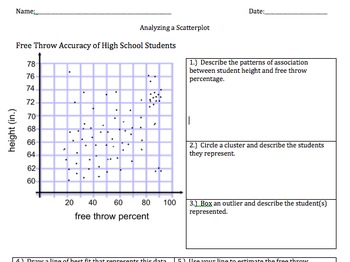
8.SP.1 and 8.SP.2 Analyze a Scatterplot
This activity hits the main intent of both 8.SP.1 and 8.SP.2. Engage students with a scatterplot relevant to their lives that explores the association between student height and free throw accuracy. They describe whether the association is linear or non-linear, positive or negative, strong or weak. Students will also identify clusters and outliers and predict what they represent. (For example, the outlier who is really tall but a really bad shot may be a center, like Shaquille O'Neal whose e
Subjects:
Grades:
7th - 9th
Types:
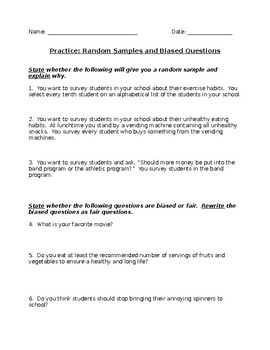
Random Samples and Biased Questions
This is a great formative assessment in a statistics unit for a lesson on random samples and bias in surveys. It could be a classwork assignment, exit ticket, or homework worksheet!
Worksheet and Answer Key included!
Subjects:
Grades:
5th - 8th
Types:
Mean - Median - Mode - Range -Understanding With Easy Steps!!!!
This power point presentation is prepared on statistical terms like mean, median, mode, and range. These terms describe properties of statistical distributions. In statistics, a distribution is the set of all possible values for terms that represent defined events.
The presentation is prepared in a very simple language with clear and simple example so that students of grades 3-4-5-6 can understand the concept smoothly. Easy steps for calculating the above terms will help students a lot in remov
Subjects:
Grades:
4th - 8th, Staff
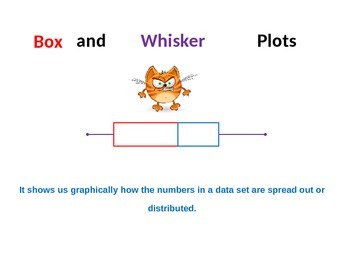
Box and Whisker Plot Analysis and Construction including Outliers
I use this MS PowerPoint presentation file to kickoff our study of Box Plots in my Pre-Algebra and Math I classes. It reviews in detail how to analyze a data set and to construct a Box Plot to accurately depict the distribution of the data (numbers). It is a totally animated ppt file and very easy for students to understand. Any of the ppt animations can be modified as desired by the presenter (teacher). It also includes 2 example problems for the students to complete at the end of the slid
Subjects:
Grades:
7th - 9th
CCSS:
Chance and data (probability) multiple choice math test
Chance and data (probability) multiple choice math testIncludes:- 24 multiple choice math questions- finding probability with dice, spinners, bar charts and colored ballsTags:chance and data, probability, multiple choice, chance with dice, chance with spinners, chance test questions, probability test, probability questions
Subjects:
Grades:
5th - 8th
Types:
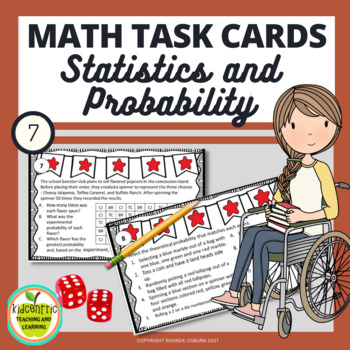
Math Task Cards - Statistics and Probability
Great versatile and engaging resource for reviewing the concepts of probability and statistics. Your seventh graders will be actively engaged as they use random sampling to draw inferences about a population, draw informal comparative inferences about two populations, and investigate, use, and evaluate probability models. There are many ways you can use these NO PREP cards with your 7th grade math class. Think how easily you can just print and use these cards with activities such as:Bellwork
Subjects:
Grades:
6th - 8th
Types:
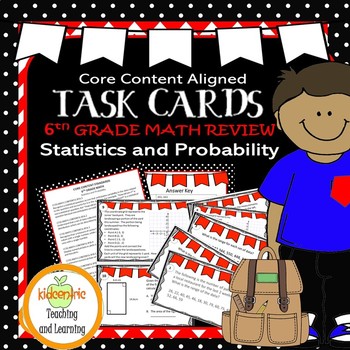
Math Task Cards 6th Grade Statistics Probability | Mean, Median, Number Lines
This set of Sixth Grade Math Task Cards review majors concepts of mean, median and the distribution of numerical data sets on a number line, including dot plots, histograms, and box plots. Checking your student's understanding of the Core Content Domain of Ratios and Proportional Relationships, the cards may be used by individual students, or as the basis for cooperative group work. Versatile and engaging, there are many ways you can use these NO PREP cards with your class. Think how easily y
Subjects:
Grades:
5th - 7th
Types:
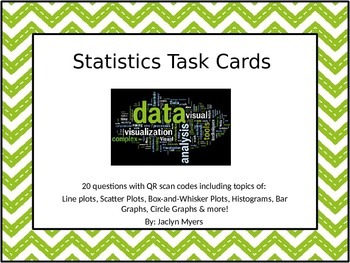
Statistics Task Cards with QR Code Scanners
Statistics Task Cards includes 20 questions that are complete with QR Codes that students can scan with a QR Code reader on a wireless device (iPad, tablet, cell phone, etc.) to check answers.
Includes statistics topics of: Line plots, Scatter Plots, Box-and-Whisker Plots, Histograms, Bar Graphs, Circle Graphs & more! They are presented in PowerPoint and could be used for whole class instruction, printed one to a page as large task cards, or multiple to a page for mini-task cards.
The que
Subjects:
Grades:
6th - 8th
Types:
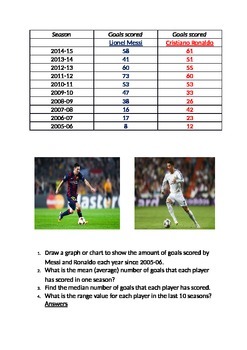
Messi v Ronaldo - mean, mode, median, range.
Data handling with a soccer twist. Find the mean, median, mode and range of the goals scored by the extraordinary Lionel Messi and Cristiano Ronaldo over the last 10 years, and create a variety of graphs and charts in the process.
Subjects:
Grades:
5th - 12th
Types:
Describe the Distribution of a Data Set
This Common Core statistics and probability lesson teaches students how to describe the distribution of a data set. The lesson includes research-based strategies and strategic questions that prepare students for Common Core assessments. In this lesson, students will describe the distribution of data sets. This lesson focuses on describing a variety of statistical distributions in different situations. Students are asked to describe different related data sets and describe what that means. In
Subjects:
Grades:
5th - 7th
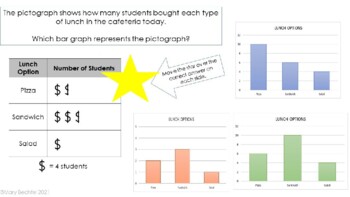
Comparing Circle Graphs to Other Graphs Practice
In this PowerPoint activity, students will be given a pictograph, bar graph, line/dot plot, or circle graph and will be asked which graph represents the same data. 5 practice slides are provided, as well as a final slide which asks students which type of graph is best for answering certain questions.This is also available as a Google Slides activity!
Subjects:
Grades:
6th - 8th
Types:
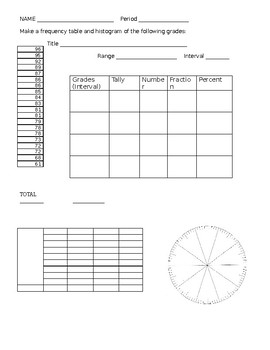
Intro to Frequency Tables - Histogram
This is a student friendly worksheets for students to learn how to collect data and make a frequency table and Histogram and circle graph. First page, set of grades are used as data, then students can fill in the frequency table.
Subjects:
Grades:
5th - 7th
Types:
Ratios with Skittles Activity Solving and Simplifying
What student doesn't love learning something in Math while using candy as the manipulative? Solving-and-Simplifying Ratios-with-Skittles-Candy-Worksheet-Activity is a FUN worksheet to use with Skittles candy for practicing how to write and simplify ratios. You get the original, microsoft word document that is FULLY EDITABLE in case you'd like to add, delete, or edit the problems on the worksheet. You'll enjoy using this year after year!Be sure to L@@K at my other 1,285+ TERRIFIC teaching resourc
Subjects:
Grades:
4th - 7th
Types:
Also included in: Ratios Worksheets and Activities Smartboard Slides Lesson BUNDLE
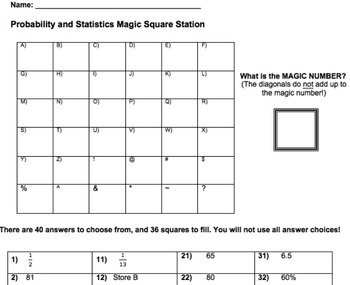
Probability and Statistics Magic Square Activity
This magic square activity is a fun and engaging way to review probability and statistics skills! The students work to solve each problem while also determining what the "magic number" is. The student worksheet and activity are included. My 7th graders loved working on this for an end of the year review assignment!
Subjects:
Grades:
6th - 9th
Types:
Showing 1-24 of 132 results


