
1,585 results
7th grade statistics microsofts


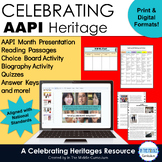

Chance and Probability Activities Theoretical & Experimental Probability Bundle
Are you teaching your students all about chance and probability and looking for fun hands-on probability activities? This print and digital bundle of worksheets, task cards, slideshows and note-taking sheets on Probability will reinforce the understanding of theoretical probability, experimental probability, language of chance, sample space, predictions, lists, tree diagrams, dependent probability events and independent probability events.Both US and British English spelling and terminology file
Subjects:
Grades:
4th - 7th

Statistics Project - Statistics Olympics
Engage your students in their study of statistics as they compete in self-created Olympic style events. This project will engage students and help them discover meaning and apply concepts including measures of central tendency, quartiles, outliers, variance, standard deviation, z-scores, box plots, histograms, normal and skewed distributions. This project can be completed in approximately 6-8 days (50-min class periods) ** March 2023 Update **Visual updates to all slides and documentsRubric ali
Subjects:
Grades:
6th - 12th
CCSS:

Math March Madness Full Tournament Project {BUNDLE}
Harness the excitement of NCAA March Madness with this huge project for secondary math teachers that follows all stages of the tournament! This Common Core aligned bundle comes with bonus parts not sold individually in my store so you can create a rich immersion in the tournament, practice probability and statistics and learn some interesting new ones along the way! Save $3 plus get bonus content by bundling!You can pick and choose which parts you would like to incorporate, or follow my schedu
Subjects:
Grades:
6th - 12th, Higher Education
Types:

Statistics Unit - Mean Absolute Deviation - Populations and Samples - Box Plots
Make lesson planning easy with this no-prep Statistics - Mean Absolute Deviation - Populations and Samples - Box-and-Whisker Plots Unit! Included are 8 ready-made lessons to teach finding mean absolute deviation as well as interpreting and creating box-and-whisker plots. This unit is very easy to use and will save you a lot of time! Your students will learn how to find mean absolute deviation and interpret box-and-whisker plots by using our editable PowerPoints with guided notes. Students will l
Subjects:
Grades:
6th - 8th
Also included in: 7th Grade Math Curriculum Bundle

Skittles Chance and Probability (Editable)
Chance and Probability activity using yummy Skittles!!!
Students are to predict the colours and quantities before they open the skittles bag. Students are to complete a chance experiment where they use a tally to collect their data. Students then transfer their data in fractions, decimals and percentages. Students are to create a bar graph using their data as well as answer chance and probability questions about the data. I used this with my grade 5/6 students and they loved it!
Subjects:
Grades:
3rd - 10th
Types:

2024 March Mathness Madness NCAA Basketball Probability and Statistics Lesson
Every year I get my students excited about the NCAA Men's Basketball March Madness Tournament. I see articles written year after year from statisticians, sports journalist, celebrities, etc. about predicting the perfect bracket. Regardless that most have accepted it is nearly impossible, it has not deterred these enthusiast from finding an algorithm or a machine that can predict the outcomes.This packet guides students through 1) An explanation of what March Madness is all about2) A reading abou
Subjects:
Grades:
4th - 12th
Types:

Mean, Median, Mode, and Range (Bundled Unit) - Distance Learning
This is an enjoyable, interactive, and engaging bundled unit covering mean, median, mode, and range (and introduces outliers). This unit is great for 5th and 6th graders and 7th graders who struggle with these concepts.Included in this bundled unit:PowerPointAnimated and fun 4-part, 21-slide PowerPoint (multi-day use)-Part 1 – The Meaning of Mean-Part 2 – Getting in the Middle of Median-Part 3 – Making the Most of Mode-Part 4 – Home, Home on the RangeEach section offers plenty of practice probl
Subjects:
Grades:
5th - 7th

Math Doodle - Finding Probability using a Tree Diagram - Easy to Use Notes w PPT
7th Grade Math Doodle Sheet Product INCLUDES:Math Doodle Sheet - blank and keyGuided Practice Sheet - blank and keyPowerPoint – to show students the KEY– two versions of both sheets included: INB and large 8.5 x 11 size ALL TEKS Aligned– plan for the FULL year included with table of contents page for INB! SAVE BIG and buy the WHOLE YEAR SET found here:7th Grade Math Doodle Sheets ALL YEAR SET WHOLE YEAR SET List below:ALL TEKS Aligned– plan for the FULL year included! LIST of 88 Doodle Sheets p
Subjects:
Grades:
6th - 8th

Box and Whisker Plot PPT and Guided Notes 6.SP.2 , 6.SP.4 , 6.SP.5
Box and Whisker Plot
This PPT lesson teaches students the vocabulary that goes with box and whisker plots as well as the steps for creating a box and whisker plot.
Along with the PPT are guided notes where students can answer questions while watching the PPT as well as the answer key. They also have the chance to create their own box and whisker plot. This is a great introductory lesson. This matches Common Core Standards for 6th grade, but could be adapted and used for other grades as we
Subjects:
Grades:
5th - 8th

Math Activity for March Madness
The Math Activity for March Madness is the perfect way to celebrate March Madness and incorporate math skills. Students fill out the bracket with who they think will win each game and advance. Students are responsible for updating their bracket, highlighting each win, and adding up their points per round. Students analyze and reflect on their data, as well as previous tournament data. Whoever has the most points wins an award, as well as the runner-up!Bulletin board letters are included. You cou
Subjects:
Grades:
6th - 8th
Types:
CCSS:

Geometry: Survey and Circle Graph Project Made Fun!
Circle Graph Geometry Activity - Everyone just wants their piece of the pie!This is a fun, multi-faceted project that will have your students creating and implementing a survey, converting their results using various mathematical operations, and creating a poster-sized circle graph incorporating various geometry skills.This Survey and Circle Graph Project Unit Includes:PowerPoint:-Fun, interactive, 3-part PowerPoint slide presentation that walks you and your students through the entire project f
Subjects:
Grades:
5th - 7th

Candy Probability: Discovery of EXPERIMENTAL vs. THEORETICAL Probability
Middle Schoolers LOVE probability!
This is a GREAT lesson around Halloween when the kids are already hyped up on sugar and want to 'talk' to their classmates.
This activity allows the students to DISCOVER the differences between EXPERIMENTAL and THEORETICAL probability and connect it to everyday experiences. The probability lesson lends itself to fractions, decimals, percents, data collection, rational & irrational numbers, statistical graphs (box and whiskers, frequency tables...), measu
Subjects:
Grades:
5th - 9th
Types:

Chance & Probability Math Worksheets Special Education Statistics & Probability
This unit on Chance and Probability contains printable and digital math worksheets for special education. This statistics and probability unit is for students who take alternate assessments.This Chance and Probability unit helps students understand how to determine the probability of an event and all its possible outcomes. The worksheets, which use pictures and color coding, are differentiated. There are many ways for students to practice these skills in this unit that are at different levels.
Subjects:
Grades:
7th - 9th

Theoretical vs. Experimental Probability PPT & Guided Notes BUNDLE
This BUNDLE includes a PowerPoint Lesson and a corresponding Guided Notes Packet to assist students in learning about theoretical and experimental probability. Students will learn the concepts of theoretical and experimental probability, as well as how to find the probabilities of each. Plenty of real-life examples are included to give students ample opportunities to practice the skills. Overall, the 21-slide PowerPoint and 6-page guided notes packet covers the following topics:Theoretical Proba
Subjects:
Grades:
6th - 9th

Probability - Tree Diagrams for independent and dependent events
To save you some time when you are preparing your lessons on dependent and independent events, I have collected a bunch of problems that can be solve by drawing tree diagrams and made a slide show of the questions and there answers. The tree diagrams are animated to enable you to explain as you go on. They can also be adjusted very easily and quickly to fit any other problems that you want you learners to solve.There are 6 examples of dependent events and 9 of independent events. I have also inc
Subjects:
Grades:
7th - 12th

Favorite Sports Team: Data Displays and Measures of Central Tendency Project
Students will create a poster using sports statistics. Depending on the time of year, you may want to use football scores, basketball scores, data from the Olympics, etc. Students will use the internet (or you can print out statistics for them) to find sports data.
The students really buy into this project because it is about something they are interested in - their favorite sports team!
Students will display their knowledge of several data displays: line plot, tally chart, histogram and bo
Subjects:
Grades:
5th - 8th
Types:

Probability PowerPoint Review Math Game
⭐️ This probability game is a fun way for students to practice or review probability skills. Included are basic and compound probability questions. ⭐️ Students must choose 24 of 30 probabilities to include on their Bingo card. The PowerPoint includes 30 questions for them to solve in order to play Bingo. ⭐️ Included in the file is the PowerPoint, Bingo Card and Answer sheet. Available in the following bundle: 7th Grade Curriculum Resources Mega BundleLicensing Terms:By purchasing this product, y
Subjects:
Grades:
7th - 9th
Also included in: 7th Grade Math Curriculum Supplemental Activities Bundle

Box and Whisker Plots Real World Math Middle School Math
About this Resource:Students use current weather data from all over to create box plots using measures of variation. This is a create way to tie in some live science data! Topic Covered:*Measures of Variation/Variability*Describing Graphs*Box Plots / Box-and-Whisker Plots Ways to use this product in your classroom:-project-assessment-independent or partner work✓ Teacher Tested✓ Student Approved*This product has been used in my classroom and enjoyed by my students!Other products with similar con
Subjects:
Grades:
6th - 8th
Types:
Also included in: Box and Whisker Plots Line Plots Measures of Center Bundle Activities

Probability of Compound Events (Guided Notes)
This lesson is meant to be used as guided notes for a whole class.
Students begin by learning what makes 2 events independent. After slowly working through a problem about rolling a die and choosing a card, they discover that they can multiply probabilities when working with these compound events. They then attempt problems involving picking marbles from a bag. Next, they learn about dependent events, and finally, mutually exclusive events.
The last 2 pages are a copy of the key.
Subjects:
Grades:
6th - 12th
Types:

Mean, Median, Mode, Range Scavenger Hunt Around the World Escape Room Earth Day
Digital Earth Day Math statistics activity to practice calculating the measure of central tendency including mean, median, mode, and range. This Adventure Math Escape Room is EDITABLE in Google Slides™ or PowerPoint™. Students have to visit all places pinned on the Earth map to find riddles.They have to solve tasks along the way to get the final code. Students must enter this code going to the Earth's core to win.This is a self-checking activity. The recording sheet in Google Sheets™/Excel™ is i
Subjects:
Grades:
5th - 8th

Statistics (Algebra 1 Curriculum - Unit 10) | Bundle for Common Core
This is a great unit that covers a Statistics unit in an Algebra 1 course! 9 lessons are included!All documents are EDITABLE!Included:- Overview of the common core alignment (PDF)- Guided notes for 9 lessons (PDF and Word)- PowerPoints that coordinate with the guided notes (PPTX)- Mid-Unit Quiz (PDF and Word)- Unit Test (PDF and Word)-Pacing Guide (PDF and Word)Each lesson contains a learning scale, warm up (do-now or bell ringer), key concepts, vocabulary, and examples for students to follow w
Subjects:
Grades:
7th - 12th
CCSS:

Mean, Median, Mode, and Range (PowerPoint Only) - Distance Learning
Mean, Median, Mode, and Range - This is an enjoyable, interactive, and engaging PowerPoint covering mean, median, mode, and range (and introduces outliers). This presentation is great for 5th and 6th graders and 7th graders who struggle with these concepts.Included in this Lesson:PowerPointAnimated and fun 4-part, 21-slide PowerPoint (multi-day use)-Part 1 – The Meaning of Mean-Part 2 – Getting in the Middle of Median-Part 3 – Making the Most of Mode-Part 4 – Home, Home on the RangeEach section
Subjects:
Grades:
5th - 7th
Types:

Finding and Comparing Interquartile Range (IQR)
This activity is designed for Texas TEKS listed below. Students use strips of data to fold into 'quartiles' and calculate the IQR.
represent numeric data graphically, including dot plots, stem-and-leaf plots, histograms, and box plots.[6.12A]
interpret numeric data summarized in dot plots, stem-and-leaf plots, histograms, and box plots.[6.13A]
compare two groups of numeric data using comparative dot plots or box plots by comparing their shapes, centers, and spreads.[7.12A]
Subjects:
Grades:
6th - 8th

6th Grade Statistics - Game Show Review Game
This is the perfect way to review your 6th grade statistics unit!Students will love this Jeopardy-like game to review the Statistics standards. This game is aligned with Common Core standards. Categories include STATISTICAL QUESTIONS, DATA DISTRIBUTION, MEASURES OF CENTER, DATA DISPLAYS, SUMAMRIZE DATA, AND VOCABULARY. Points range from 100 - 500, which reflect the increase in difficulty from 100-point basic review questions to 500-point questions that require students to apply their knowledge.*
Subjects:
Grades:
5th - 7th
Also included in: 6th Grade Game Show Review Games BUNDLE
Showing 1-24 of 1,585 results

TPT is the largest marketplace for PreK-12 resources, powered by a community of educators.
IXL family of brands