Math Curriculum For 4th Grade, 5th Grade, and 6th Grade Print and Digital
- Zip
What educators are saying
Products in this Bundle (22)
showing 1-5 of 22 products
Bonus
Description
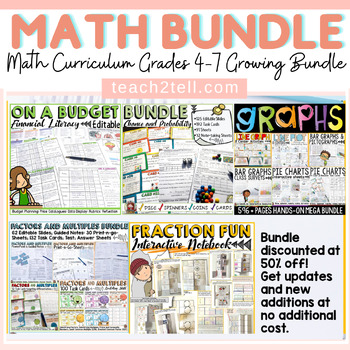
Are you looking for a comprehensive Math Curriculum bundle that includes a variety of resources and activities that cover 4th Grade, 5th Grade, and 6th Level standards?
This Math Curriculum Bundle has a range of print and digital resources to teach and reinforce key math concepts aligned to the standards.
Best of all, this curriculum bundle is growing, this means more resource topics will be added over time in addition to lots and lots of bonus resources. Save heaps by purchasing at the current price.
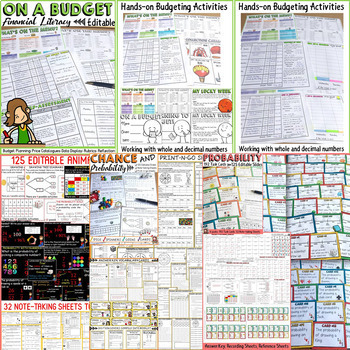
To read more about the resources included in this growing bundle to date, please access the given links.
All additional resources will be added to this bundle as and when they are created.
Recent Updates
- 33 Boom Digital Cards added on the Language of Chance
- 34 Boom Digital Cards on Probability with a Standard Dice
- 45 Boom Digital Cards on Probability with Playing Cards
- Digit Value Bundle
- Expanded Form Bundle
Bonus Resources
Access the bonus resources by clicking on the link in the pdf file.
- Properties of 3D Shapes Boom Digital Cards x 50
- Nets of 3D Shapes Boom Digital Cards x 37
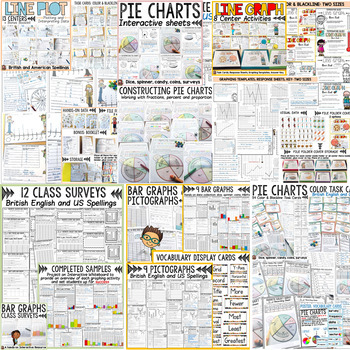
- Pie Charts: 54 Black and White Task Cards
- Place Value: Comparing Numbers Bundle
- Place Value: Ordering Numbers Bundle
- Place Value: Rounding Numbers to Ten Bundle
- Place Value: Rounding Numbers to Hundred Bundle
- Math Practice Test 1
- Equivalent Fractions Using Cross Multiplication
- Equivalent Fractions Using Simplification
- Math Digital Test Prep 1
- Math Digital (Boom Cards) Test Prep 2
- Math Practice Test 2 (Print & Google Slides )
- Math Practice Test 3 (Print & Google Slides)
- Naplan Prep Tests 1-3 (Aus) (Print & Google Slides)
- Naplan Prep Tests 1-3 (Aus) (Boom Decks)
- Math Digital (Boom Cards) Test Prep 3
Find K-3 Math Curriculum Bundle below:
More Classroom Bundles For You
- Sentence Structure Bundle
- Reading Strategies Bundle
- Writing Bundle
- Fairy Tale Classroom Decor
- Superhero Classroom Decor
Thank you for visiting Teach2Tell. New resources are 50% off - do follow the store to get notified :)
Please contact me with any queries regarding this resource.
Thank you!
Laurane@teach2tell


