Finding and Comparing Interquartile Range (IQR)
Joshua Elmhorst
33 Followers
Grade Levels
6th - 8th
Subjects
Resource Type
Formats Included
- PPTX
Pages
5 pages
Joshua Elmhorst
33 Followers
What educators are saying
"Fantastic resource! The materials I purchased on Teachers Pay Teachers exceeded my expectations. The content was well-organized, engaging, and a valuable addition to my teaching toolkit. Thank you for creating such high-quality resources!"
This was a great resource for box and whisker plots. Students were engaged. I like how the worksheet was formatted.
Description
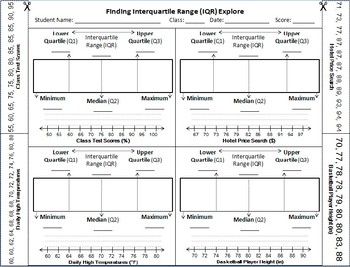
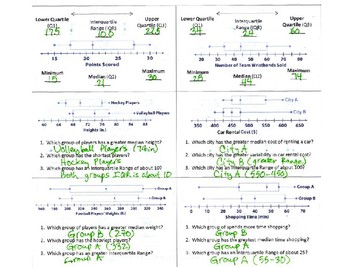
This activity is designed for Texas TEKS listed below. Students use strips of data to fold into 'quartiles' and calculate the IQR.
represent numeric data graphically, including dot plots, stem-and-leaf plots, histograms, and box plots.[6.12A]
interpret numeric data summarized in dot plots, stem-and-leaf plots, histograms, and box plots.[6.13A]
compare two groups of numeric data using comparative dot plots or box plots by comparing their shapes, centers, and spreads.[7.12A]
Total Pages
5 pages
Answer Key
N/A
Teaching Duration
N/A
Last updated Feb 10th, 2017
Report this resource to TPT
Reported resources will be reviewed by our team. Report this resource to let us know if this resource violates TPT’s content guidelines.


