530 results
Statistics assessment microsofts
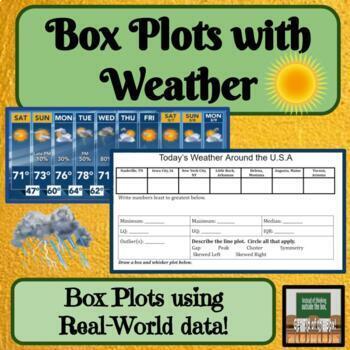
Box and Whisker Plots Real World Math Middle School Math
About this Resource:Students use current weather data from all over to create box plots using measures of variation. This is a create way to tie in some live science data! Topic Covered:*Measures of Variation/Variability*Describing Graphs*Box Plots / Box-and-Whisker Plots Ways to use this product in your classroom:-project-assessment-independent or partner work✓ Teacher Tested✓ Student Approved*This product has been used in my classroom and enjoyed by my students!Other products with similar con
Subjects:
Grades:
6th - 8th
Types:
Also included in: Box and Whisker Plots Line Plots Measures of Center Bundle Activities
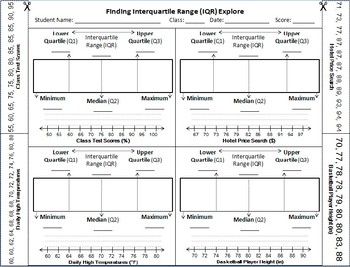
Finding and Comparing Interquartile Range (IQR)
This activity is designed for Texas TEKS listed below. Students use strips of data to fold into 'quartiles' and calculate the IQR.
represent numeric data graphically, including dot plots, stem-and-leaf plots, histograms, and box plots.[6.12A]
interpret numeric data summarized in dot plots, stem-and-leaf plots, histograms, and box plots.[6.13A]
compare two groups of numeric data using comparative dot plots or box plots by comparing their shapes, centers, and spreads.[7.12A]
Subjects:
Grades:
6th - 8th
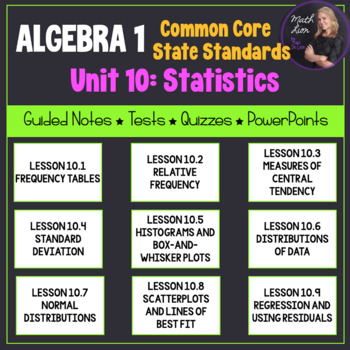
Statistics (Algebra 1 Curriculum - Unit 10) | Bundle for Common Core
This is a great unit that covers a Statistics unit in an Algebra 1 course! 9 lessons are included!All documents are EDITABLE!Included:- Overview of the common core alignment (PDF)- Guided notes for 9 lessons (PDF and Word)- PowerPoints that coordinate with the guided notes (PPTX)- Mid-Unit Quiz (PDF and Word)- Unit Test (PDF and Word)-Pacing Guide (PDF and Word)Each lesson contains a learning scale, warm up (do-now or bell ringer), key concepts, vocabulary, and examples for students to follow w
Subjects:
Grades:
7th - 12th
CCSS:
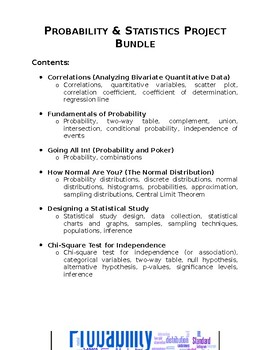
Probability & Statistics Project Bundle
A bundle that contains six different projects for a Probability & Statistics high school course. This bundle includes: Correlations (Analyzing Bivariate Quantitative Data) Fundamentals of Probability Going All In! (Probability, Combinations, and Poker) How Normal Are You? (The Normal Distribution) Designing a Statistical Study Chi-Square Test for Independence These projects are designed to engage students in authentic, hands-on, performance-based tasks. For each of these projects, students c
Subjects:
Grades:
9th - 12th
Types:
CCSS:
Create a Line Plot Project
Looking to assess line plots? Look no further!This project incorporates learning targets, skills, collaboration, and technology.Directions: With a partner, create a question used to collect data from your classmates. (Examples: In inches, how long is your hand? In cm, what is the circumference of your head? etc.) Then, create a line plot with your results. Use fraction intervals.Requirements:Create a reasonable question (Teacher approval required)Collect at least 20 pieces of dataCreate a line p
Subjects:
Grades:
4th - 6th
Types:
CCSS:
Also included in: Upper Grade Math Projects
Create Your Own Statistics Project
This document contains a statistics project description that allows students to create their own project. This is suitable for high school and beginning level college statistics class. Students will design their own study - formulate research questions, collect data, organize and summarize the findings, calculate confidence interval and construct hypothesis testing. Certain restrictions are outlined in the document. Students will experience the complexity of constructing their own study. They ar
Subjects:
Grades:
10th - 12th, Higher Education, Adult Education
Types:
Cards Probability Scavenger Hunt Activity
A mix of 26 addition rule, multiplication rule, and conditional probability questions about a standard deck of cards. Find the cards in question to lead you to the next problem! This resource is a word document so you may edit it to your liking. I made this activity for my CP Probability&Statistics class - but it is also challenging enough for an AP level statistics class. It generally takes about two class periods - but my kids LOVE it and it is GOOD practice. The problems may be a little t
Subjects:
Grades:
9th - 12th, Higher Education
Types:
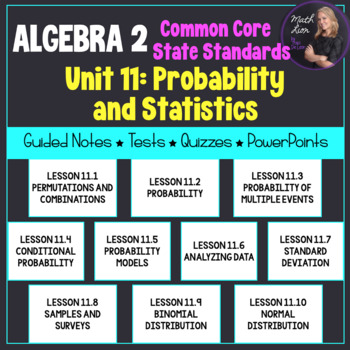
Probability and Statistics (Algebra 2 - Unit 11) | Math Lion
Documents are editable!!! This unit includes PowerPoint presentations, coordinated guided notes with answers, a mid-unit quiz, and unit test covering Probability and Statistics Functions. The PowerPoint includes warm ups (do-now or bell ringer), key concepts, and examples for students to follow. 10 lessons included! The lessons are 30 - 45 minutes each. 11.1: PERMUTATIONS AND COMBINATIONS 11.2: PROBABILITY 11.3: PROBABILITY OF MULTIPLE EVENTS 11.4: CONDITIONAL PROBABILITY 11.5: PROBABILITY MODEL
Subjects:
Grades:
9th - 12th
CCSS:
Also included in: Algebra 2 Unit Plans 9-12 (Bundled) | Math Lion
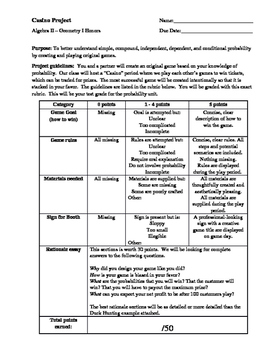
Carnival Probability Project
A project that feels like a game!
Students must create their own game, using probability to ensure THEY are favored to win....much like the house in a casino. Students can make games involving dice, spinners, cards, "fishing" ducks out of a pond, etc.
Assessed skills include: fundamental counting principal, theoretical probability, experimental probability, independent events, dependent events, creativity, writing, presentation. *Students must already know basic probability to complete this
Subjects:
Grades:
8th - 12th
Types:
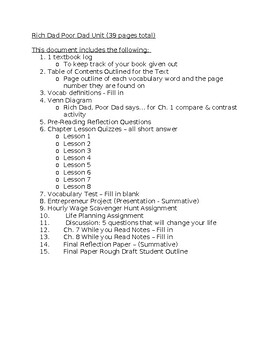
Rich Dad Poor Dad - ENTIRE UNIT (39 PAGES)!!!!!
The following is an ENTIRE UNIT for the book Rich Dad Poor Dad. It is a WORD DOC so you can edit it to your liking!This ENTIRE UNIT includes the following:1. 1 textbook log o To keep track of your book given out2. Table of Contents Outlined for the Texto Page outline of each vocabulary word and the page number they are found on3. Vocab definitions - Fill in4. Venn Diagram o Rich Dad, Poor Dad says… for Ch. 1 compare & contrast activity5. Pre-Reading Reflection Questions6. Chapter Lesson Quiz
Subjects:
Grades:
9th - 12th, Higher Education
Types:
Version B End of Unit Assessment/Retake for IM Algebra 1 Math™ Unit 1
This is a Version B End of Unit Assessment aligned to Illustrative Mathematics, Unit 1 (One-variable Statistics) for Algebra 1. This Version B assessment is aligned to the same CCSS standards as the original exam and is modeled after the same type of problems accompanying Unit 1 for Algebra 1. So it naturally lends to standards based grading, if that is a practice in which you choose to participate. This exam can be used as a retake for students to show mastery after reteaching lessons or studen
Subjects:
Grades:
8th - 12th
Types:
CCSS:
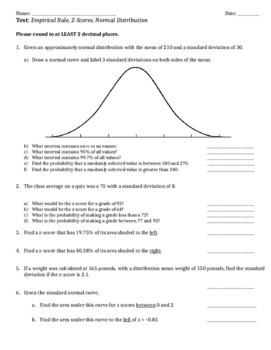
Emprical Rule, Z-Scores, Normal Distribution Assessment/Review
This product can be used as a review or assessment for the empirical rule, z-scores and standard deviation, and the normal distribution. This is meant for a regular Statistics class, not AP. Can also be used for the Algebra II unit on Statistics.
Subjects:
Grades:
10th - 12th
Types:
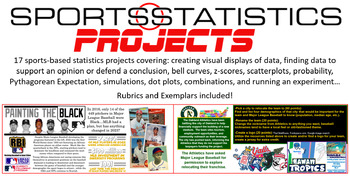
Sports Statistics - Projects ONLY! 17 projects in all
Most of the projects allow students to choose their own topic to display their understanding of statistical topics. Students will:Create a graph of their choosing given dataDesign an infographic on the subject of their choosingResearch and defend their G.O.A.T. choice in a variety of categoriesUse demographics to relocate and rebrand a professional franchiseResearch social injustices in sports and display the dataCreate a bell curve based on career statistics of Michael JordanCompare the salari
Subjects:
Grades:
8th - 12th
CCSS:

IB Psychology Internal Assessment (IA) Analysis and Statistics Slides
Walk your students through the Analysis section of the Internal Assessment (IA). Google slides include content and background information on statistics, directions and links for students to follow while they write their Analysis section, create their table and graph, and run descriptive statistics and inferential statistics with their raw data. Includes links to online calculators for mean, standard deviation, Mann Whitney U Test, Wilcoxon Test. Analysis rubric and links to two IA exemplars incl
Subjects:
Grades:
9th - 11th, Higher Education, Adult Education
Statistics and Probability Practice Problems (MSM)
If you are looking for extra practice problems for statistics and probability standards within 6th grade math, you are in the right place! You will be getting a google slideshow for each standard under statistics and probability that have multiple practice problems, using peardeck. The slides can also be modified to be conducted by the teacher without using the peardeck extension by simply deleting the peardeck attachments. The answers for each problem are in the speaker notes on each slide.*All
Subjects:
Grades:
6th
Also included in: 6th Grade Math Standards-Based Practice Problems
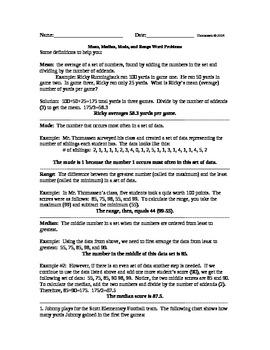
Mean Median Mode and Range Word Problems FREE
These free mean, median, mode, and range word problems (10 problems in a total of 20 pages with the definition overview and answer key) combine silly names and teacher-created data for the students to work with. Also, the beginning provides a quick definition overview of how to solve mean, median, mode, and range. This organizer provides a great amount of space for students to show their work. Don’t forget to peruse my other resources for Mean, Median, Mode, and Range. Thank you!
Subjects:
Grades:
5th
Types:
AP Statistics Kahoots (10 total): No Prep game/activity for AP Statistics Exam
Get ready to supercharge your AP Statistics exam prep with these 10 Kahoot links! With 10-15 questions in each Kahoot, your students will have daily practice to help them ace the exam at the end of the year. These Kahoots are specifically designed using AP test material, so you can be sure your students are getting the best preparation possible. Perfect for quick spiral review, warm-ups, or closing out class, these Kahoots are the ultimate tool for helping your students succeed. And with the opt
Subjects:
Grades:
10th - 12th
Types:
CCSS:
Grade 9 Geography STRAND D: Changing Populations Unit Bundle
This STRAND D: Changing Populations Bundle is a perfect fourth unit for Grade 9 Canadian Geography and includes over 100 slides of content, one quiz, and two bonus assessment activities! The bundle includes 6 products total. Answer keys are include for all quizzes and assessments. Content includes: Population trends in Canada, Immigration Trends in Canada, and Population Characteristics!! Bonus content includes 12 Kahoot Links to use as a study tool. Play as a class or students can challenge the
Subjects:
Grades:
7th - 10th
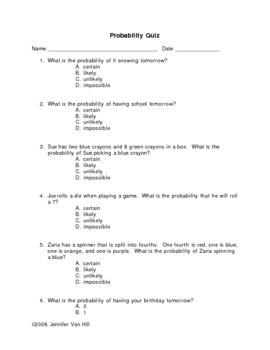
Probability Quiz
This is a probability quiz that focuses on identifying probability in the terms of certain, impossible, likely and unlikely. This quiz is in the format of of multiple choice and constructed response questions. An answer key is also provided.
Jennifer Van Hill
Subjects:
Grades:
3rd - 5th
Types:
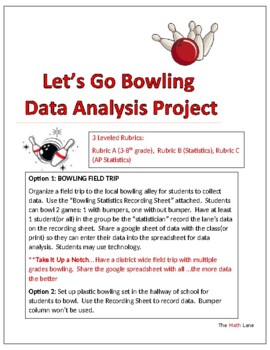
Let's Go Bowling Statistics STEM Project & Field Trip (3-12 and AP Stat)
Great END OF YEAR project. Get ready to strike up some fun with your students on a field trip to the bowling alley or right in your own hallway with a plastic bowling set! This isn't just any ordinary field trip - it's a real-world data collection extravaganza. 3 different leveled rubrics (Grade 4-10, Statistics, AP Statistics) so students can analyze the data based on their math knowledge. Students will be able to practice creating and analyzing graphical displays, scatterplots, construct c
Subjects:
Grades:
Not Grade Specific
Types:
Also included in: High School Statistics Project Bundle
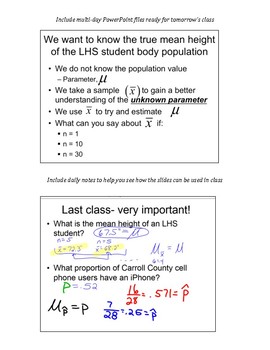
AP Statistics Stats Sampling Distributions Central Limit Theorem CLT tests keys
This is a large unit covering all things with sampling distributions. This includes three multi day powerpoint files, many handouts, two quizzes, a test (and answer keys).
The answer keys for handouts, tests and quizzes are included. I've also included my daily class notes so you can see how the powerpoint files can be used in class.
Subjects:
Grades:
10th - 12th, Higher Education
Probability Bundle - PowerPoint, HW, Quizzes with Answer Keys
This bundle contains all the probability work I have posted from my Probability & Statistics course, including the answer keys that go along with it.
Subjects:
Grades:
10th - 12th, Higher Education
CCSS:
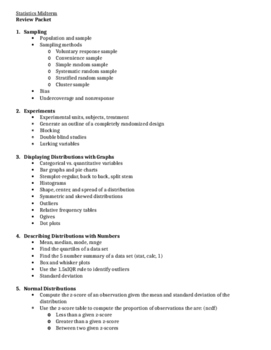
Statistics Midterm Review
This is a 50 question review for a regular level statistics midterm (not AP). Topics include:
Sampling and Experiments
Displaying Distributions with Graphs
Describing Distributions with Numbers
Normal Distributions
Scatterplots and Correlation
Linear Regression and Residuals
Subjects:
Grades:
10th - 12th
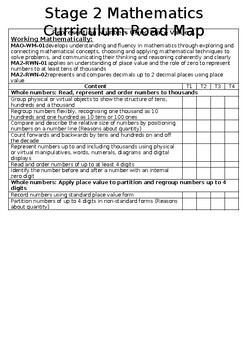
NSW STAGE 2 MATHEMATICS CURRICULUM ROADMAP (NEW K-6 SYLLABUS)
Template of a Stage 2 Roadmap for the new NSW Mathematics SyllabusThis template has a simple layout that will allow you to highlight the different Mathematic learning areas to cover throughout the year. It covers the content areas in Part A and Part B. It is organised in a way that is reflective of the live document from the NSW Curriculum website.A great tool to use for your staff planning days at the beginning of the year or each term.
Subjects:
Grades:
3rd - 4th
Showing 1-24 of 530 results


