15 results
7th grade statistics assessments for Easel Activities
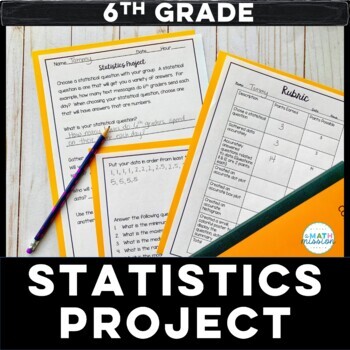
Math Statistics Project Based Learning Dot Plot Box Plot Histogram
Set your students loose to practice their statistics skills! This project is great for a culminating assessment. This project is centered around students coming up with a statistical question, and gathering data on that question. Students answer statistical questions, and create a dot plot, box and whisker plot and histogram based on the data collected. A summary of their findings is then created to display for others to see. A rubric is included for grading purposes. This project actively
Subjects:
Grades:
5th - 7th
Types:
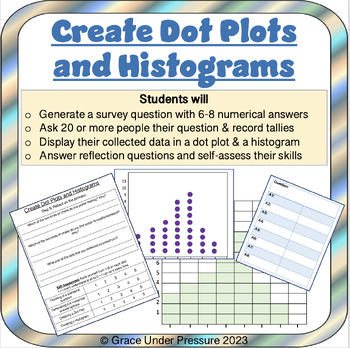
Create Dot or Line Plots and Histograms: Display Numerical Data 6th Grade Stats
Help your 6th grade and middle school math students learn about statistics, data collection, and data presentation in a hands-on and meaningful way! In this product students will:- Generate their own survey question with 6-8 numerical answers (samples included)- Ask 20 or more people their question & record answers in a tally chart- Display their collected data in a dot plot or line plot and then a histogram (the blank templates are included so all students can be successful)- Answer reflect
Subjects:
Grades:
5th - 8th
Types:
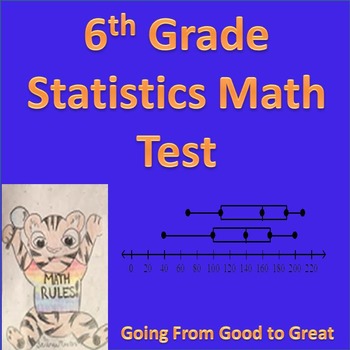
6th Grade Statistics Math Test
This test covers the 6th grade statistics common core standards. Using PARCC and MCAS questions. This covers all the 6th statistics standards. The topics include mean, median, mode, range, histograms, box and whiskiers, dot plots, outliers, and skewers. Answer key included.
**This is also included in a year-long math test bundle that includes 9 unit tests, study guides, test with goals and challenging test covering all the 6th grade Common Core Math Standards. Get the bundle here:
6th Grade
Subjects:
Grades:
5th - 8th
Types:
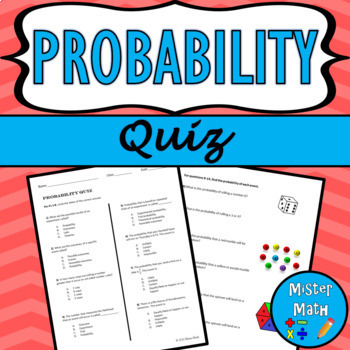
Probability Quiz
Assess your students' knowledge and skills in finding probability with this 22-question quiz! The quiz includes multiple choice and open-response questions, as well as real-life application questions. An answer key is also provided. Overall, the 4-page quiz covers the following topics:Outcomes & EventsDescribing LikelihoodSimple ProbabilityTheoretical/Experimental ProbabilityUsing Theoretical ProbabilityMaking PredictionsComparing Theoretical & Experimental Probability☆ CLICK HERE TO CHE
Subjects:
Grades:
6th - 9th
Also included in: Probability MEGA BUNDLE
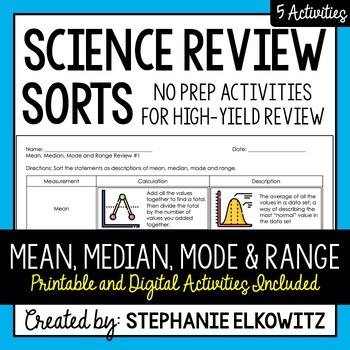
Mean, Median, Mode & Range Review | Printable, Digital & Easel
A NO-PREP resource to review HIGH-YIELD topics in science! My science review sorts help students develop mastery of science concepts, review difficult concepts and avert common misconceptions and misunderstandings. Each individual review sort will target a specific topic. By doing so, students focus their attention and effort on advancing their understanding of scientific ideas and concepts related to that topic. Important Notes:• Download a FREE High-Yield Review Activity• Save $$ with the Natu
Subjects:
Grades:
4th - 9th
Types:
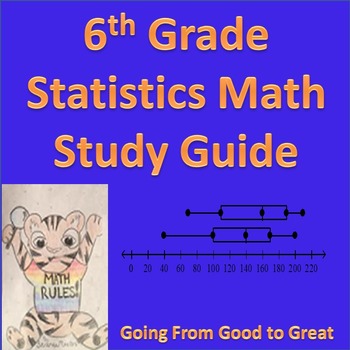
6th Grade Statistics Study Guide
This test covers the 6th grade statistics common core standards. Using PARCC and MCAS questions. This covers all the 6th statistics standards. The topics include mean, median, mode, range, histograms, box and whiskiers, dot plots, outliers, and skewers. Answer key included. This goes with the Statistics test in my store.
**This is also included in a year-long math test bundle that includes 9 unit tests, study guides, test with goals and challenging test covering all the 6th grade Common Core
Subjects:
Grades:
5th - 7th
Types:
Also included in: Statistics Test Bundle
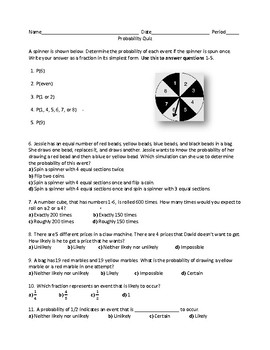
Probability Quiz: 7th Grade Unit 6
This quiz is aligned to the Common Core standards of 7th grade math. It covers the standards addressed in Unit 6, Probability. 28 problems are provided that assess the following topics:Likelihood of an event.Identifying independent and dependent events.Using a uniform probability model to find the probability of a simple event.Determining total number of outcomes by using the Fundamental Counting Principle. Finding theoretical probability. Finding experimental probability.Explaining the differen
Subjects:
Grades:
6th - 8th
Types:
Also included in: 7th Grade Bundle - Units 1, 2, 3, 4, 5, & 6 - Task Cards + Quizzes!
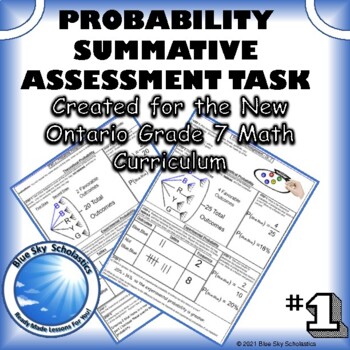
Probability End of the Unit Summative Assessment Task for Grade 7
A probability summative assessment that can be used as either an end of a unit assignment or test and aligns with the 2020 Ontario grade 7 math curriculum. These tasks will test students' abilities to determine and compare the theoretical and experimental probabilities of two independent events happening and of two dependent events happening. ***************************************************************************WHAT'S INCLUDED:1st Sheet: Determine the theoretical probability of 2 independe
Subjects:
Grades:
7th
Types:
Also included in: Probability Unit Bundle - NEW 2020 Ontario Math Curriculum Grade 7
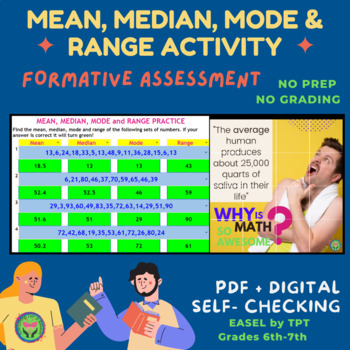
Mean, median, mode and Range Self-checking Digital Activity + PDF
ThIS SELF-CHECKING PUZZLE activity is exactly what you need for your classroom or distance/at home learning. It is fun for your students to discover the puzzle. It’s an engaging, interactive, and self-checking Math game! It is perfect for sixth and seventh grade students. Whit this activity your students can practice finding the mean, median, mode, and range of a set of numbers. It is perfect as an exit ticket or formative assessment to check students' understanding after this lesson.This activi
Subjects:
Grades:
6th - 7th
Types:
CCSS:
Also included in: Mean, Median, Mode and Range FUN BUNDLE
6th Grade Statistics Challenging Test
This test covers the 6th grade statistics common core standards. Using PARCC and MCAS questions. This covers all the 6th statistics standards. The topics include mean, median, mode, range, histograms, box and whiskiers, dot plots, outliers, and skewers. Answer key included. This test is for students who need more of a challenge on a test. This test has more questions than my regular test as well as more challenging questions.
**This is also included in a year-long math test bundle that include
Subjects:
Grades:
5th - 7th
Types:
Also included in: Statistics Test Bundle
6th Grade Statistics Math Test with Goals
This test covers the 6th grade statistics common core standards. Using PARCC and MCAS questions. This covers all the 6th statistics standards. The topics include mean, median, mode, range, histograms, box and whiskiers, dot plots, outliers, and skewers. Answer key included. This test included math goals/objectives so that students are able to see after the test where they went wrong. At the end there is a space for you to correct to see how well they did for each goal. When going back to see wha
Subjects:
Grades:
5th - 7th
Types:
Also included in: Statistics Test Bundle
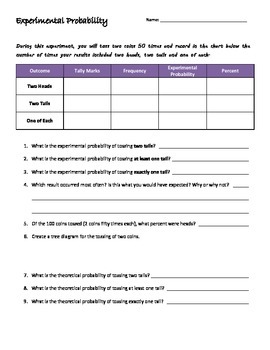
Experimental Probability Investigation
During this investigation, students will toss two coins 50 times and record in the chart below the number of times your results included two heads, two tails and one of each. Students will use the information to explore the concept of experimental probability. Students will compare experimental probability to theoretical probability.
Subjects:
Grades:
5th - 7th
Types:
Also included in: Probability Games Bundle
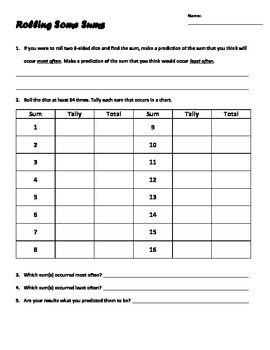
Rolling Some Sums Probability Game
Students will be using 2 8-sided dice. They will first make a prediction of the sum that you think will occur most often and the sum that you think would occur least often.
After predicting, students will carry out the experiment. Students will analyze and graph their results.
Students will not only find experimental probability of the rolling two 8-sided dice, but also make a table of the theoretical probability. They will then compare the two.
Subjects:
Grades:
6th - 7th
Types:
Also included in: Probability Games Bundle
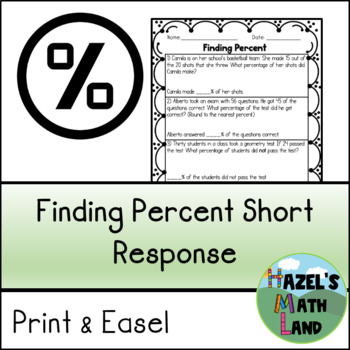
Finding Percent Short Response Questions (Print & Easel)
This resource is a great way to asses the students knowledge on finding the percent of a ratio. There are a total of 12 questions. Students are given a scenario and asked to find the percentage representation of the given relationship. There is enough space between questions for students to show their work. Answer Key Included.ABOUT THIS RESOURCE6 pages3 WorksheetsExcellent for Middle and High SchoolANSWER KEY INCLUDED******************************************************************************
Subjects:
Grades:
6th - 9th
Types:
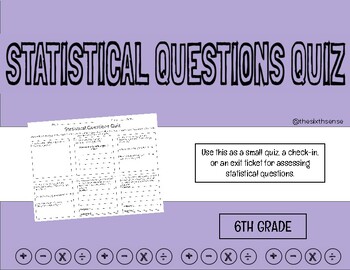
Statistical Questions Quiz
This is a simple statistical questions quiz that contains 6 questions that review various types of situations students may encounter when defining, recognizing and writing statistical questions. The quiz is worth 12 points, 2 points per question giving students more opportunity to earn points by showing work & giving accurate answers. This easy-to-grade quiz is perfect for a quick check for understanding before an assessment.
Subjects:
Grades:
4th - 9th
Types:
Also included in: 6th Grade Math Quiz Bundle
Showing 1-15 of 15 results


