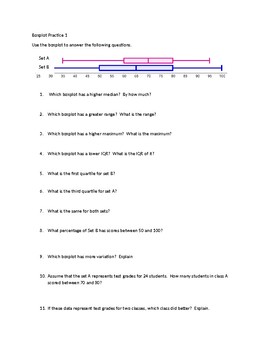
Boxplot Practice
Math Clips MathWare
196 Followers
Grade Levels
6th - 12th
Subjects
Resource Type
Standards
CCSS6.SP.B.4
CCSSHSS-ID.A.1
CCSSHSS-ID.A.2
CCSSHSS-ID.A.3
Formats Included
- Word Document File
Pages
11 pages
Math Clips MathWare
196 Followers
Description
This contains 5 boxplot worksheets analyzing, comparing and describing two boxplots. There are 3 easier ones and 2 that are more advanced. Students will have to identify and compare median, range, IQR, quartiles, minimum and maximum. They will interpret which has more variation and be able to interpret which set of scores is better. The worksheets are created in Word and the questions are fully editable. The first three can be used in middle school math or Algebra I. The 2 that are more advanced can be used at the beginning of an AP stats class. I also included 4 additional pictures of 2 boxplots that can be used.
Total Pages
11 pages
Answer Key
Included
Teaching Duration
1 hour
Last updated Mar 24th, 2017
Report this resource to TPT
Reported resources will be reviewed by our team. Report this resource to let us know if this resource violates TPT’s content guidelines.
Standards
to see state-specific standards (only available in the US).
CCSS6.SP.B.4
Display numerical data in plots on a number line, including dot plots, histograms, and box plots.
CCSSHSS-ID.A.1
Represent data with plots on the real number line (dot plots, histograms, and box plots).
CCSSHSS-ID.A.2
Use statistics appropriate to the shape of the data distribution to compare center (median, mean) and spread (interquartile range, standard deviation) of two or more different data sets.
CCSSHSS-ID.A.3
Interpret differences in shape, center, and spread in the context of the data sets, accounting for possible effects of extreme data points (outliers).


