TPT
Total:
$0.00

Statistics Project - Statistics Olympics

Rated 4.91 out of 5, based on 55 reviews
4.9 (55 ratings)
;
Tyler McKell
125 Followers
Grade Levels
6th - 12th
Standards
Formats Included
  • Zip
Pages
34 pages
$4.00
$4.00
Share this resource
Report this resource to TPT
Tyler McKell
125 Followers

What educators are saying

I thought this was such a good idea! My students did a great job with this activity and really were using the statistics we were learning in class.
My students loved participating in the Statistic Olympics. They were able to use their creativity to create their games and were happy to share their results with the class.

Description

Engage your students in their study of statistics as they compete in self-created Olympic style events. This project will engage students and help them discover meaning and apply concepts including measures of central tendency, quartiles, outliers, variance, standard deviation, z-scores, box plots, histograms, normal and skewed distributions.

This project can be completed in approximately 6-8 days (50-min class periods)

** March 2023 Update **

Visual updates to all slides and documents

Rubric alignment with CCSS

Student slide template

Excel spreadsheet for digital results

Award certificates

Materials Included:

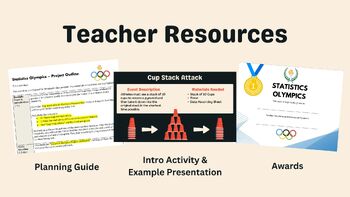
Project Planning - Teachers Guide (PDF and Word)

Introduction cup stacking activity (PowerPoint)

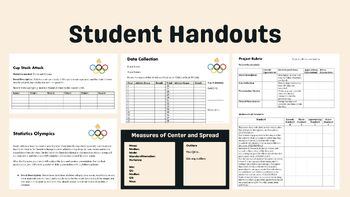
Cup stacking activity sheet (PDF and Word)

Project Instruction page and rubric (PDF and Word)

Data collection sheet (PDF, Word, Excel)

Finished example presentation (PowerPoint)

Award certificates (PDF)

PowerPoint and Word documents can be converted to Google Slides and Docs by uploading them to Google Drive.

Total Pages
34 pages
Answer Key
Included with rubric
Teaching Duration
1 Week
Report this resource to TPT
Reported resources will be reviewed by our team. Report this resource to let us know if this resource violates TPT’s content guidelines.

Standards

to see state-specific standards (only available in the US).
Represent data with plots on the real number line (dot plots, histograms, and box plots).
Use statistics appropriate to the shape of the data distribution to compare center (median, mean) and spread (interquartile range, standard deviation) of two or more different data sets.
Interpret differences in shape, center, and spread in the context of the data sets, accounting for possible effects of extreme data points (outliers).
Use the mean and standard deviation of a data set to fit it to a normal distribution and to estimate population percentages. Recognize that there are data sets for which such a procedure is not appropriate. Use calculators, spreadsheets, and tables to estimate areas under the normal curve.
Understand statistics as a process for making inferences about population parameters based on a random sample from that population.

Reviews

Questions & Answers

125 Followers