280 results
Free 7th grade statistics microsofts
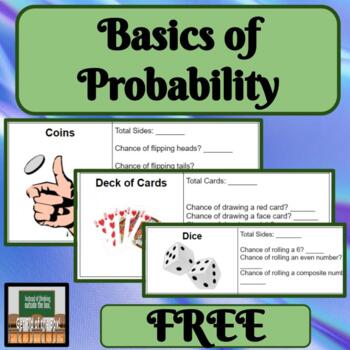
Basics of Probability Dice Cards Coins
About this Resource:Many students do not know all that is needed about dice, coins, and decks of cards. In order to be successful, it is important to cover all of this information first. Topic Covered:*Probability Ways to use this product in your classroom:-whole class-exploration-hands-on-small group-independent Other products with similar content.M&M's ProbabilityBox Plots with WeatherVisuals with Measures of Central TendencyCreating Line Plots
Subjects:
Grades:
6th - 9th
Types:
Also included in: Probability Bundle Hands On Dice Cards Coins Simple Probability

Celebrity Birthday Fun Probability Activity for Pre-Algebra and Algebra classes
This 12 minute narrated, animated PowerPoint presentation makes learning the difference between theoretical probability and experimental or empirical probability fun for students. It is intended for 7th, 8th, or 9th grade Algebra classes. It reviews a few Key terms such as probability, event, sample space, etc. and then concentrates on the famous probability birthday problem or paradox in which given a group of 50 people, 97% will share the same birthday.
Three student handouts are included
Subjects:
Grades:
7th - 10th
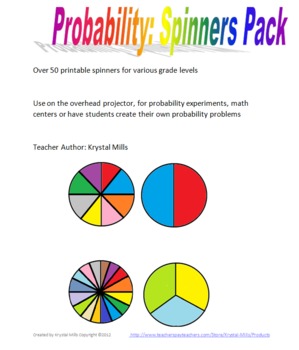
Probability Spinners Pack
This resource includes spinners for probability problems and experiments that could be used in various grades.
Included:
-blank spinners (2,3,4,5,6,8,10 and 16 spaces)
-numbered spinners (2,3,4,5,6,8, and 10 spaces)
-printable sheets (4 spinners to a page) of blank spinners with 2,3,4,5,6,8,10 and 16 spaces
-colored spinners (2,3,4,5,6,8,10 and 16 spaces)
Over 50 spinners that can be used with various grades and for various activities. Ready to print and go!
Teacher Author: Krystal Mills
pr
Subjects:
Grades:
3rd - 8th
Types:
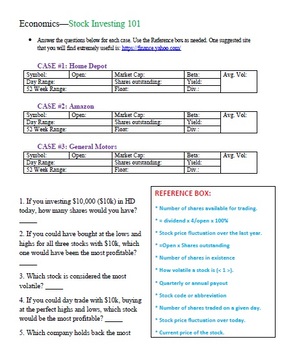
Stock Investing 101
For high school (and savvy middle school) economics students, Stock Investing 101 is a great tool for students to explore stocks on the Stock Market. This worksheet can be easily edited by simply changing the companies that the students need to investigate in order for it to be used over and over again. Estimated time for student completion: 45-60 minutes
Subjects:
Grades:
7th - 12th
Types:
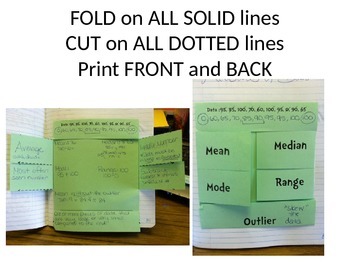
Mean, Median, Mode, Range, Outlier FOLDABLE
This is a download for a one page cut only foldable. Directions are simple, CUT on all dotted lines, FOLD on all solid lines. Gives you 6 flaps to write under with vocabulary on top.
Also includes one set of data to find the mean, median, mode and range (answers included).
This is downloaded in powerpoint, so it can be changed if you do not need the "oulier" topic.
Also, this is an EVEN number of data, so the median will have to be found between 2 numbers: 85 and 90.
This involves deci
Subjects:
Grades:
6th - 8th
Types:
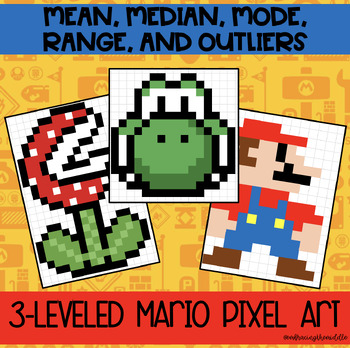
Mean, Median, Mode, Range 3-Leveled Mario Pixel Art for Middle Schoolers
This MARIO pixel art activity has three different levels of mean, median, mode, range, and outlier problems. Gives teachers more flexibility to support individual student needs. This resource can be used in the classroom as a formative assessment, independent classwork, homework, or much more! Students will solve 10 equations to reveal a mystery image. Gives students automatic feedback and is no prep. Awesome activity to incorporate technology into the math classroom. Keep math fun and engaging
Subjects:
Grades:
6th - 8th
Types:
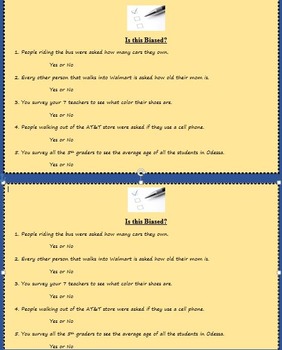
Is this Biased? (populations and random samples)
This is a 5 question quiz, exit ticket, do now, or homework assignment that reviews how surveys and samples can be biased sometimes. All 5 can be answered with a yes or no for whether it is indeed a biased survey. Enjoy and please rate and/or comment on this product!
Subjects:
Grades:
5th - 9th
Types:
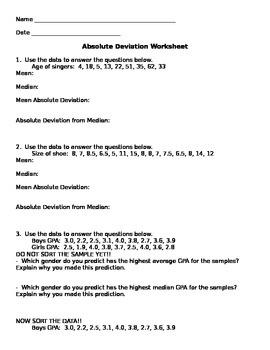
Mean Absolute Deviation Worksheet
Students will practice finding measures of central tendency and then calculate the mean absolute deviation as well as the absolute deviation from the median.
Subjects:
Grades:
6th - 10th
Types:
CCSS:
Manage Sports Statistics in Google Drive / Google Sheets - Activity
Use Google Sheets to analyze sports data
This activity lets students practice several fundamental spreadsheet skills, including:
-renaming documents
-adding formulas
-inserting / formatting charts
Screenshots demonstrate how to do all of the above in Google Sheets, the spreadsheet application in the Google Drive suite. You can add additional statistics to customize the assignment for your students and adjust the level of difficulty.
Aligned to the following Massachusetts Technology Literacy
Grades:
5th - 8th
Types:
INTERPRETING AND CREATING LINE GRAPHS
Are you looking for a quick way to assess your students' mastery of double line graphs? Here it is! This can be used to practice creating double line graphs or to determine previous learning. It is ready to go! I would use it in all middle school grades maybe even lower if students are ready! This activity could also be changed to practice double bar graphs, if you want to extend the learning. It could also be used for substitute work in upper grades. It is a great way to teach creating graphs i
Subjects:
Grades:
5th - 8th
Types:
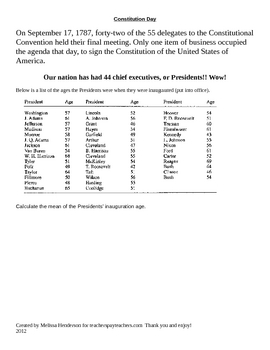
Constitution Day - Math activity
Constitution Day. It is a law that all teachers must teacher the constitution on this day regardless of the content. I developed this activity for my 6th grade students to complete on constitution day. This would also be a great cross curriculum item as well!
Subjects:
Grades:
5th - 7th
Types:

Mean, Median, Range, Mode Quiz
This is a five problem math quiz. It can be used for a quiz, but also as a review. There are five sets of numbers where students must find the mean, median, range, and mode of each data set. The numbers are not in numerical order.
Subjects:
Grades:
3rd - 8th
Types:
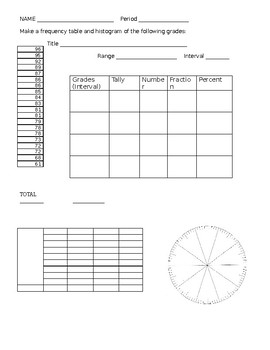
Intro to Frequency Tables - Histogram
This is a student friendly worksheets for students to learn how to collect data and make a frequency table and Histogram and circle graph. First page, set of grades are used as data, then students can fill in the frequency table.
Subjects:
Grades:
5th - 7th
Types:
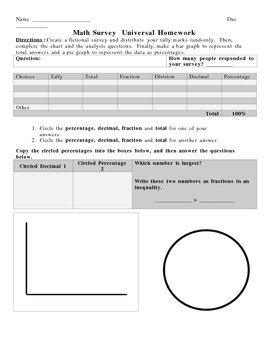
Take A Survey -- Learn Fractions, Percents and Decimals
This is a project that helps students learn to compute fractions, decimals and percents. The preview is a "universal" homework that students can complete for review any time during the year.
Take A Survey -- Learn Fractions, Percents and Decimals by Sherre Vernon is licensed under a Creative Commons Attribution-Share Alike 3.0 United States License.
Subjects:
Grades:
6th - 12th, Higher Education, Adult Education
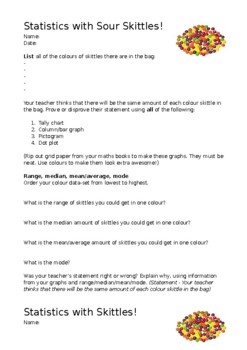
FUN Statistics with M&Ms and Skittles!
FUN Statistics worksheet for skittles, sour skittles, and M&Ms. Kids to work in groups (4-6 students per group works best). Buy one pack of skittles or sour skittles or M&Ms per group. Includes: Mean/average, mode, median, range. Graphs: Tally chart, dot plot, bar/column graph, pictogram. Edit to suit what you have covered in class.
Subjects:
Grades:
5th - 10th
Types:
Printable Box-and-Whisker Plot 2012 Top Movies Fun Algebra Activity
This Printable lists the 15 top grossing movies of 2012. Students are to create a Box-and-Whisker plot or boxplot of the data. Hopefully they will enjoy reminiscing about movies they have seen in the past. Since there are 15 movies, the data is very easy to work with and no averages are needed. To make the problem more complicated, just eliminate one of the movies. There is an answer key provided for the 15 movies. I hope your students have fun!
Thank you for purchasing my product. Please
Subjects:
Grades:
5th - 11th
Types:
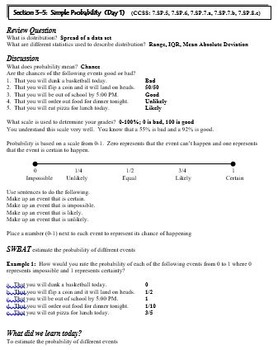
Statistics and Probability: Simple, Theoretical, Experimental, Probability
This is a 7 day lesson plan (powerpoint and hard copy) covering the topics of simple, theoretical, and experimental probability. Each lesson includes a review question, discussion, problems for teacher to model, and problems for the students to try. The lesson plan includes days of instruction, days of practice, assignments, and activities.
Subjects:
Grades:
7th - 9th
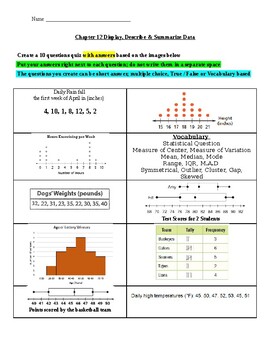
Display, Describe & Summarize Data
Images & vocabulary lists that will give students an opportunity to create their own quizTopics - Mean, Median, Mode, Range, MAD, IQR, cluster, gaps, outliers, histograms, dot plots, box plots, frequency tables & raw data
Subjects:
Grades:
4th - 7th
Types:
Box and Whisker Plot PowerPoint
This is a PowerPoint presentation on how to use data to make a box-and-whisker plot. It contains step-by-step instructions, tips to reduce common errors, independent and group practice slides, and a partnered kinesthetic activity. Enjoy!
Subjects:
Grades:
5th - 8th
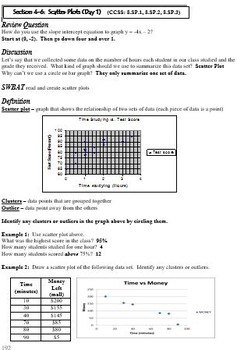
Statistics and Probability: Scatter Plots and Best Fit Lines
This is a 9 day lesson plan (powerpoint and hard copy) covering the topics of scatter plots and best fit lines. Each lesson includes a review question, discussion, problems for teacher to model, and problems for the students to try. The lesson plan includes days of instruction, days of practice, assignments, activities, and a project.
Subjects:
Grades:
7th - 9th
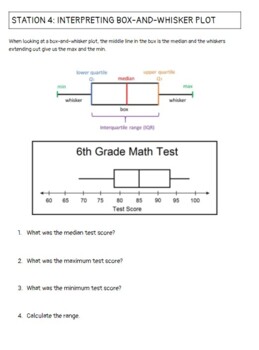
Applied Statistics End of Year Review Stations
A set of 10 stations to help students practice interpreting bar graphs, stem-and-leaf plots, and box-and-whisker plots. Also, works with finding the mean, median, mode, and range. Finally, have probability and normal distribution questions.
Subjects:
Grades:
7th - 12th
Types:
CCSS:
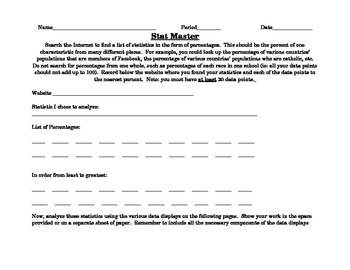
Stat Master- Statistics Analysis and Data Displays
This web-based performance task allows students to find statistics on the internet and the analyze and display the statistics using various displays. Finally, students are prompted to write about their analysis, explaining when specific displays are used and justifying their choice of a given display.
The data analysis and displays included are:
-Measures of Central Tendency (mean, median, mode)
-Measures of Variation (extremes, quartiles, or five-point summary)
-Box-and-Whisker Plot (or Box p
Subjects:
Grades:
5th - 9th
Types:
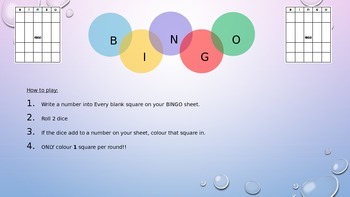
2 Dice Probability Bingo Game
Simple Bingo game where students can use a bingo game as an experiment to discover which values are the highest probability in either the sum of 2 dice or the difference of 2 dice.
Students fill in the sheets with values they think will come up. They get to fill in one square per round if the have a value that matches the sum/difference of the dice. After the first game is played, it should be played again to allow students to use their understanding to improve their chances. Eg. using more
Subjects:
Grades:
5th - 8th
Types:

Two-Way Frequency Table Activity
8.SP.4 8th grade Common Core statistics. Students survey fellow classmates and make a two-way frequency table. Questions involving marginal relative frequencies and joint relative frequencies follow.
Subjects:
Grades:
7th - 9th
Types:
CCSS:
Showing 1-24 of 280 results


