10 results
7th grade statistics microsofts on sale
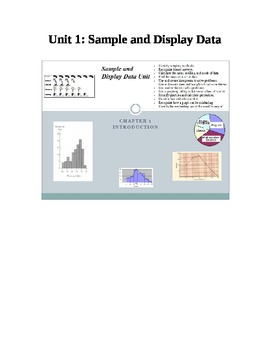
Sample and Display Data Unit
Sample and Display Data Unit
Includes learning objectives, vocabulary sheets, pre-test, test and retest.
Covers:
- Identify sampling methods.
- Recognize biased surveys.
- Calculate the mean, median, and mode of data.
- Find the range of a set of data.
- Use and create histograms to solve problems.
- Use and create stem and leaf plots to solve problems.
- Use scatter plots to solve problems
- Use a graphing utility to determine a line of best fit.
- Identify quartiles and calculate percentil
Subjects:
Grades:
5th - 12th, Higher Education, Adult Education, Staff
Types:
Mean, Median, Mode, Box and Whisker, Pie Chart, Bar Graph
Mean, Median, Mode, Box and Whisker, Pie Chart, Bar Graph
Subjects:
Grades:
6th - 12th
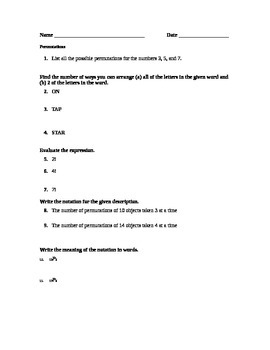
Permutations Quiz or Worksheet
This is a 20 question permutation quiz or practice worksheet. Can be used in Algebra 1, 2 or Statistics.
Subjects:
Grades:
7th - 12th, Higher Education, Adult Education, Staff
Types:
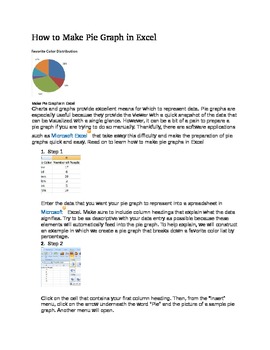
How to Make Pie Graphs/Line Graphs in Excel
How to Make Pie Graph in Excel and How to Make Line Graphs in Excel. A step by step guide for students.
Subjects:
Grades:
4th - 12th, Higher Education
Types:
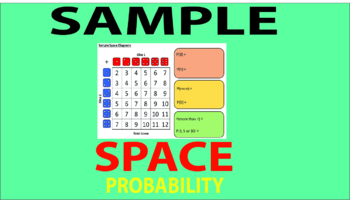
Sample Space Probability
An excellent lesson plan on Sample Space Probability. Starter with working out the probability of each events by placing the statements on the right place on the probability line. List of vocabulary on probability and definition on Independent events. Example of Sample Space Diagram and tasks for practise. Worksheet to practise Sample Space Diagram in real context scenarios. "And Rule" P(A and B) = P(A) x P(B)
Subjects:
Grades:
5th - 8th
CCSS:
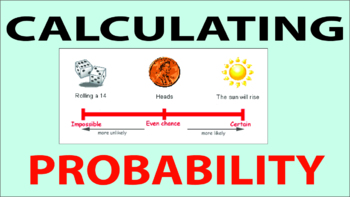
Calculating Probability
An excellent lesson plan on Calculating Probability. Starter on matching correct fraction, decimals and percentages. Powerpoint examples to explain the concepts on calculating probability in an engaging manner. Differentiated worksheets to allow students to make excellent progress (Alphabet worksheet - Fair progress, Cards and dice worksheet - Good progress, Likely, Unlikely, Certain worksheet - Excellent progress).
Subjects:
Grades:
5th - 8th
CCSS:
Probability
This is a great resource for test prep, homework, warm ups, stations, task cards, or summer review packet. This is a power point presentation with the answers popping in for easy use, however you can select to print multiple slides onto a single page and make into a booklet. There are twenty days of problems. Each day there are several problems.
Subjects:
Grades:
6th - 8th
Types:
Also included in: 7th Grade Math Summer Packet or Test Prep
Inferences, Data, and Mean Absolute Deviation
This is a great resource for test prep, homework, warm ups, stations, task cards, or summer review packet. This is a power point presentation with the answers popping in for easy use, however you can select to print multiple slides onto a single page and make into a booklet. There are twenty days of problems. Each day there are several problems.
Subjects:
Grades:
6th - 8th
Types:
Also included in: 7th Grade Math Summer Packet or Test Prep

How to Make Pie Graph/Line Graphs in Excel
How to Make Pie Graph in Excel and How to Make Line Graphs in Excel. A step by step guide for students.
Subjects:
Grades:
4th - 12th, Higher Education
Types:
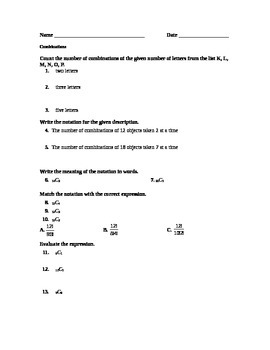
Combinations Quiz or Worksheet
18 question combinations quiz or worksheet. Could be used in an Algebra 1, 2 or Statistics course.
Subjects:
Grades:
7th - 12th, Higher Education, Adult Education, Staff
Types:
Showing 1-10 of 10 results


