
105 results
7th grade graphing resources for Microsoft Excel


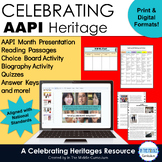

Lucky Charms Cereal Data Analysis and Graphing Project St. Patrick's Day
Looking for a way to review data analysis and graphing skills without it being a bore? This Lucky Charms Cereal Data Analysis and Graphing Project is a fun activity to incorporate in March for St. Patrick's Day, but of course it works at any time of the year in a graphing unit or in a math-integrated unit. Your students will smile when you whip out the box of Lucky Charms and tell them that they are to pretend they are the Quality Control Department at the Cereal Company! This activity is fun an
Subjects:
Grades:
6th - 8th
Types:
NGSS:
MS-ETS1-4

Excel Lessons - Creating Charts
No Prep! These lessons are great as a first Excel Chart lesson or for students already a little familiar with creating charts. Students love the data for these charts because the data is centered around things they love – their cell phones! In Lesson 1, students will create 5 different charts from step-by-step directions which include Chart Titles, Chart Styles, Axis Titles, Data Labels, and Moving Chart to its own Sheet.In Lesson 2, students will create 5 charts from provided data as well as ch
Grades:
5th - 12th
Types:

Excel Spreadsheets Million Dollars Activity
This resource allows students to understand the following: How graphs change when spreadsheet data is alteredUse of SUM() functionsHow graphs are madeComponents of a graphAdvantages of spreadsheets over pen and paper methodsStudents use this resource to understand how altering data in spreadsheets allow graphs to change. They understand such concepts by trying to spend a Million Dollars in a minute. Students are then expected to complete the associated worksheet which accompanies the spreadsheet
Grades:
5th - 12th, Adult Education
Types:

Spreadsheet - Basics Introduction & Graphing (Excel and Google Sheets)
This lesson guides students via animation and a tutorial video before completing the assignments. This is completely paperless with no prep, and lessons are done on either Microsoft Excel or Google Sheets. Students learn to enter data and start graphing. This resource is intended for learners first starting out or those who need a reminder on using spreadsheets or creating graphs. If you want your students' research papers to include eye-catching graphs, give this lesson a try. Start the slides
Subjects:
Grades:
1st - 8th
Types:

Parabola Transformations - Interactive
A handy guide to help new students learn how each change affects the shape and direction of parabolas. Clear color coding for the various pieces of the formula and instant updates help separate and isolate the concepts for easy, intuitive learning.Enter information using simple dropdown menus and organized blank fields to isolate each piece of the formula!Two tabs:One allows you to enter individual pieces of information to show the resulting formulaOne allows you to enter the formula to show the
Subjects:
Grades:
7th - 12th, Higher Education, Adult Education

Creating Data Tables and Graphs in Google Sheets
This is an activity that walks students through the process of organizing and entering data into a data table and then using that data to generate line, bar, and pie charts. Once the graphs are generated, the process of formatting and editing the different parts of each graph is explained.

Weather Tracking in Excel
Compatible with Google Sheets, Google Classroom, or as a stand-alone file on a PC, this product is a must have for any teacher comparing weather conditions in multiple locations!
BEFORE YOU BUY: This file is part of a larger unit. Save yourself money by purchasing the Super Science Set for Weather and Climate nstead of buying each file separately.
Purchased alone, you get:
⭐ An Excel workbook that enables students to track the weather for 5 different locations as a whole class or individ
Subjects:
Grades:
4th - 8th
Types:

Printable Graph Paper 10 Squares Per Inch Cross Stitch
Printable Graph Paper 10 Squares Per Inch Cross Stitch - Grid paper is essentially the type of paper most commonly used for drawing and sketching purposes. It is widely used for making plan charts, designing websites, developing home ideas and so forth. A great deal of businesses who need to produce a company card, business brochures, catalogues, brochures, and so forth need this kind of graph paper.
Subjects:
Grades:
5th - 12th

LINE GRAPH MAKER (AUTOMATIC)
This spreadsheet allows you to insert your independent and dependent variables into a chart and voila!... a line graph is generated as you enter in each piece of new data! Students love to take their data from a lab and watch as a graph is made right before their eyes! You can change all of the titles on the chart and the graph to suit your classes laboratory experiment needs! Students can easily print out their data to include in their lab reports!
Grades:
2nd - 12th
Types:

Skittle Statistics MS Excel Mini-Lab
This is a 1 class MS Excel lab for a computer or math class. You can have the students explore the distribution of different color Skittles in class. This is a great mini-lab or half-day activity when you school ends up with a weird schedule day. Tell them they can't eat till the Skittles till the end of class, or they will distort their numbers. Also make sure they don't throw them or shove them up their nose (Yes, stuck Skittles are hard to extract, ask me how I know..)The goal of this lab is
Grades:
6th - 12th, Higher Education, Adult Education
Types:
NGSS:
MS-ETS1-2
, HS-ETS1-2
, HS-ETS1-3
, MS-ETS1-4
, MS-ETS1-1
...
Also included in: Hands-on Science Semester Labs Bundle

Water Balloon Catcher Project - Data and Graphing - Mathematics
Transform your maths classroom into a dynamic hub of learning with this captivating data and graphing project! Designed for upper primary/middle school students, this hands-on and inquiry-based activity ensures an immersive experience in mastering data interpretation, chart creation, and understanding the role of data and graphs in advertising.In this engaging project, students will: Explore Data: Collaborate in teams to design and construct a Water Balloon Catcher using recycled materials, each
Subjects:
Grades:
5th - 9th
Types:

EDITABLE Excel Graphing Template
Teach graphing in Excel with this EDITABLE template! After collecting data, have your students represent it in a formal graph using Excel. This template provides helpful tips for students to determine the right kind of graph (bar, line, or pie) for their data and ALSO teaches them all the important parts of a graph.Assign the template for students to download and edit for a quick graphing solution or provide the pdf handouts for students who just need a little guidance!4 different kinds of graph
Grades:
7th - 12th
Types:

Manage Sports Statistics in Google Drive / Google Sheets - Activity
Use Google Sheets to analyze sports data
This activity lets students practice several fundamental spreadsheet skills, including:
-renaming documents
-adding formulas
-inserting / formatting charts
Screenshots demonstrate how to do all of the above in Google Sheets, the spreadsheet application in the Google Drive suite. You can add additional statistics to customize the assignment for your students and adjust the level of difficulty.
Aligned to the following Massachusetts Technology Literacy
Grades:
5th - 8th
Types:

Compound Inequality Graphing Practice
This excel spreadsheet includes a sheet of practice for both AND and OR compound inequalities. There are also three sheets of blank number lines, so that a teacher could write their own inequalities for students to graph.
Grades:
5th - 9th
Types:

How To Graph Using Google Spreadsheets
This is a step-by-step guide on how to use Google Spreadsheets for students in grades 5-12. Use this as a resource when guiding students through the process. Included with the directions is sample data for students to use when practicing graphing. Perfect for science experiments and science fair!
Subjects:
Grades:
5th - 12th
Types:

Spreadsheet Basics 3 - Graphing
Help your students increase their ability to access and analyze information by learning to create graphs from computer spreadsheets with Spreadsheet Basics - Graphing. This resource is no prep, with narration and instructional videos that will help you foster critical thinking and problem solving skills. The only thing your students will need is the link to the resource to begin learning important new skills.Please look at the Preview and Video to take a closer look!This online activity is bro
Grades:
4th - 7th
Also included in: Custom Bundle for Danielle A.

Rational Numbers - Super Sleuths - Culminating Activity (Mathematics)
You've finished your unit on Rational Numbers and now you're looking for a culminating activity that's different, fun and challenging at the same time! "Super Sleuths" is just what you're looking for!!Students will use what they've learned about Rational Numbers to track down the evil Dr. Irrational! He's escaped from prison and through a series of challenges, your students will be able to track him down and send him back to prison.Activities include graphing, drawing images in the coordinate

Christmas Pixel Art | Reflections | Digital Geometry | Instant Feeeback
Product Description: This Christmas themed, pixel art activity covers reflections! Students are given three points on a graph and asked to reflect one of the points. There are 10 problems. Students will reflect over the y-axis twice, the x-axis twice, the line y=x twice, a horizontal line twice, a vertical line once, and the y=-x line once.Objective: Students will be able to reflect points over various lines of reflection.Excel Student Instructions: Students will work all ten problems on the pro
Subjects:
Grades:
7th - 11th
Types:
Also included in: Christmas Transformation Bundle

Stock Market Project - 7.SP.1, 7.SP.4, 7.SP.6
Students will pick a stock to research the tendencies over the previous six months. They will analyze the trends, the central tendencies, and predict the stock's future worth based off of that data.
There is an excel spreadsheet to input the data for the stock, which will then create a graph for the student from its data. The student will need to then adjust the graph to their needs however.
Subjects:
Grades:
6th - 8th
Types:

Stock Market Project
Students will select 3 companies to follow on the stock exchange over a 4 week period. Each week they will record their company's last trade. Over the 4 weeks they will look at information on the companies, news articles on the companies, how much money they would have made or lost if they had 100 shares of the stock. At the end they will create a spreadsheet and write a summary of their findings.
Grades:
6th - 10th

Halloween Pixel Art Excel/Google Sheets
Microsoft Excel activity to use upper elementary or middle school students? This great lesson incorporates art as students learn the basics of Microsoft Excel.These are also fun lessons to use if you just need something for a one day lesson.
This download includes:
1. Teacher & Student Resources
2. Excel Template for Pixel Art
3. Legends and Sample Pictures for 3 Halloween Pictures
When completed let students make their own pictures, they will love it!
I've used this with 6th and 7th gra
Subjects:
Grades:
5th - 9th
Types:

Behavior Frequency Rate Chart w/ Target, Intensity, Duration, BIP chart/Summary
Behavior Frequency Rate Chart (dates and chart cant be edited and dates changed to current year or target)--Daily Sheet-Date Entry-Intensity Chart-Duration Chart-Target Charts-BIP Evaluation printout -BIP write upSee preview for description Excel format for editing - tabs at bottom of page for easy change of view and data entry
Subjects:
Grades:
PreK - 12th

Christmas Pixel Art | Translations | Digital Geometry | Instant Feedback
Product Description: This Christmas themed, pixel art activity covers translations! Students are given three points on a graph and asked to translate one of the points according to the given translation rule.Objective: Students will be able to translate a point on a graph.Excel Student Instructions: Students will work all ten problems on the problems tab and then input their answers on the image tab. When entering their answers, students must use parentheses, a comma, and NO spaces. As students
Subjects:
Grades:
7th - 11th
Types:

BAR GRAPH (AUTOMATIC)
This spreadsheet allows you to insert your independent and dependent variables into a chart and voila!... a bar graph is generated as you enter in each piece of new data! Students love to take their data from a lab and watch as a graph is made right before their eyes! You can change all of the titles on the chart and the graph to suit your classes laboratory experiment needs! Students can easily print out their data to include in their lab reports!
elementary science class, middle school sc
Grades:
2nd - 12th
Types:
Showing 1-24 of 105 results

TPT is the largest marketplace for PreK-12 resources, powered by a community of educators.
IXL family of brands