7 results
7th grade graphing laboratories for Microsoft Excel
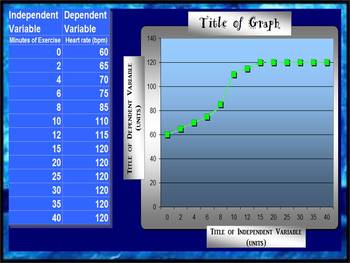
LINE GRAPH MAKER (AUTOMATIC)
This spreadsheet allows you to insert your independent and dependent variables into a chart and voila!... a line graph is generated as you enter in each piece of new data! Students love to take their data from a lab and watch as a graph is made right before their eyes! You can change all of the titles on the chart and the graph to suit your classes laboratory experiment needs! Students can easily print out their data to include in their lab reports!
Grades:
2nd - 12th
Types:
Weather Tracking in Excel
Compatible with Google Sheets, Google Classroom, or as a stand-alone file on a PC, this product is a must have for any teacher comparing weather conditions in multiple locations!
BEFORE YOU BUY: This file is part of a larger unit. Save yourself money by purchasing the Super Science Set for Weather and Climate nstead of buying each file separately.
Purchased alone, you get:
⭐ An Excel workbook that enables students to track the weather for 5 different locations as a whole class or individ
Subjects:
Grades:
4th - 8th
Types:
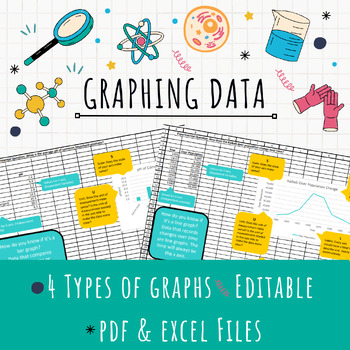
EDITABLE Excel Graphing Template
Teach graphing in Excel with this EDITABLE template! After collecting data, have your students represent it in a formal graph using Excel. This template provides helpful tips for students to determine the right kind of graph (bar, line, or pie) for their data and ALSO teaches them all the important parts of a graph.Assign the template for students to download and edit for a quick graphing solution or provide the pdf handouts for students who just need a little guidance!4 different kinds of graph
Grades:
7th - 12th
Types:
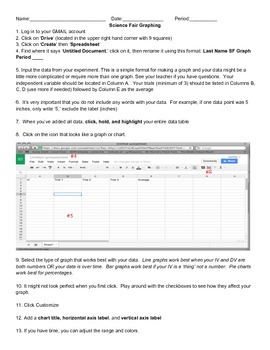
How To Graph Using Google Spreadsheets
This is a step-by-step guide on how to use Google Spreadsheets for students in grades 5-12. Use this as a resource when guiding students through the process. Included with the directions is sample data for students to use when practicing graphing. Perfect for science experiments and science fair!
Subjects:
Grades:
5th - 12th
Types:
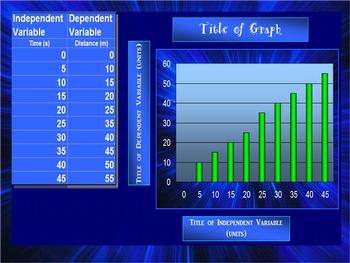
BAR GRAPH (AUTOMATIC)
This spreadsheet allows you to insert your independent and dependent variables into a chart and voila!... a bar graph is generated as you enter in each piece of new data! Students love to take their data from a lab and watch as a graph is made right before their eyes! You can change all of the titles on the chart and the graph to suit your classes laboratory experiment needs! Students can easily print out their data to include in their lab reports!
elementary science class, middle school sc
Grades:
2nd - 12th
Types:
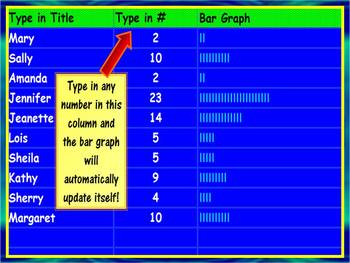
Automatic Bar Graph Maker
This activity can be used to teach students of all ages about bar graphs. This spreadsheet can be used to introduce the concept of bar graphs to elementary students as well as implemeted by mid-level & high school students in lab reports and/or presentations. It is extremely quick and easy to use! Just type in a set of numbers and it automatically creates a simple bar graph. And check out my other graph templates for line and bar graphs! They are definately worth your time!
Grades:
K - 12th
Types:
Report writing for students
You can view the images and hear my narration at YouTube URL
https://youtu.be/7HeXCH_rDMY
Copyright (C) Peter Rony 2015 All rights reserved.
I am a chemical engineering educator by profession. This PDF is an important STEM activity that is targeted for teachers starting at level 3 and continuing to level 12. It is not sufficient to have just a laboratory course. As much as possible, students should obtain quantitative “data” as a result of their experiments -- and not just qualitativ
Subjects:
Grades:
3rd - 12th
Showing 1-7 of 7 results


