208 results
7th grade graphing resources for Microsoft Excel and for early intervention
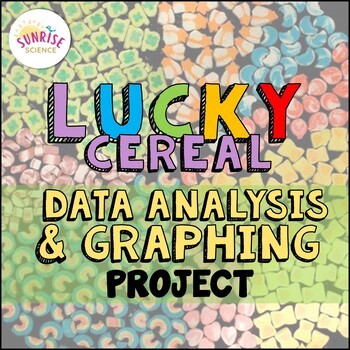
Lucky Charms Cereal Data Analysis and Graphing Project St. Patrick's Day
Looking for a way to review data analysis and graphing skills without it being a bore? This Lucky Charms Cereal Data Analysis and Graphing Project is a fun activity to incorporate in March for St. Patrick's Day, but of course it works at any time of the year in a graphing unit or in a math-integrated unit. Your students will smile when you whip out the box of Lucky Charms and tell them that they are to pretend they are the Quality Control Department at the Cereal Company! This activity is fun an
Subjects:
Grades:
6th - 8th
Types:
NGSS:
MS-ETS1-4
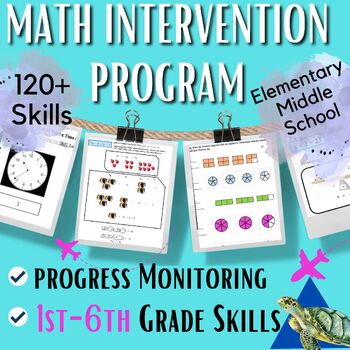
Math Intervention Program SPED & RTI progress monitoring Elem, Middle, High
Traveling Mathematics is a math intervention program that identifies and targets 120+ skills from 1st grade to middle of 6th grade. This math intervention binder includes progress monitoring, data tracking charts, teaching models, and practice pages to close gaps with special education, RTI (Tier 2 and 3), MTSS, and math classrooms. You will benefit from being able to QUICKLY identify skills to target and record all data in a snapshot. All data is logged on an (editable) excel spreadsheet per gr
Subjects:
Grades:
2nd - 10th
Types:
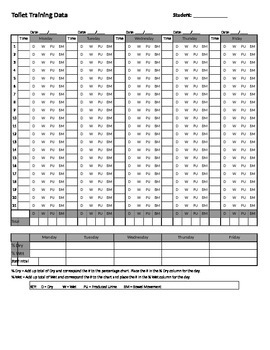
Weekly Toilet Training Data Collection Sheet - Great for ABA
Toilet Training Data Collection Sheet
This Weekly Toilet Training Data Collection Sheet allows a teacher, parent, or other provider to monitor the toileting of a child or student.
The chart monitors if a student is dry, wet, produced urine, and if the student produced a bowel movement.
The chart also monitors the percentage of dry and wet days.
See picture preview for better understanding!
Great for ABA!
Grades:
PreK - 7th
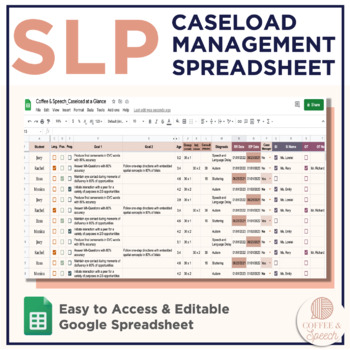
SLP Ultimate Caseload Management Spreadsheet | Caseload-At-A-Glance
SLPs have ever-growing caseloads! It is difficult to keep track of IEPs, RRs, make-up time, team members... This ULTIMATE CASELOAD MANAGEMENT SPREADSHEET will help you stay organized and have all the important information about your students in one place!The Caseload-At-A-Glance Spreadsheet includes:- Pre-written formulas to help you calculate age (Y;M)- Checklist style variables that allow you to easily filter by information- Each student's row can track: ⋒ Goals ⋒ Type of Tx (e.g., Articulatio
Grades:
PreK - 12th, Staff
Types:

IEP Time Data Sheet -SPED / AUTISM Tool- Track Wanted/Unwanted Behaviors
EDITABLE, BEAUTIFUL, and EASY TO USE over and over for IEP's, Special Education, and/or classroom data tracking. You enter the time data and the rest is done for you automatically. Simply record the amount of time a student spends on wanted or unwanted behaviors and the sheet will then automatically: total percentages and create a graph.This Data Collection Tool works great for tracking any behavior related to time. For example a student with autism interacting at recess; how much time any child
Grades:
PreK - 12th, Adult Education
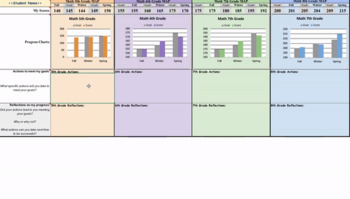
MAP Score Tracker for Students (with Charts, Reflections, & Action Plan)
Goal Setting, Progress Tracking, and Technology Skill integration in a simple one-pager! Perfect for grades 5-8 to learn how to use Microsoft Excel or Google Sheets, and to take responsibility for their own progress. Help students set goals and write reflections on their progress in a document that will follow them across grade levels. Perfect size for printing or sharing with parents during conferences.Teachers in grades 1-4 can fill in data and develop goals and reflections for students as we
Grades:
1st - 8th
Types:
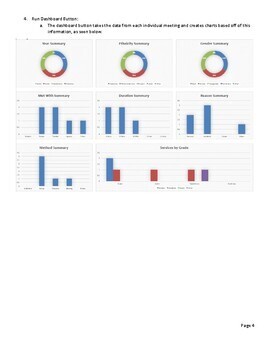
School Counselor Data Tracker- ASCA model!
Now with fully editable categories and headings! (Adjust grade levels, reason for visit, method of visit, etc).This is a program, created in excel, that tracks school counselor's meeting data and produces an easy to read excel doc as well as a dashboard of statistics.See the user guide (preview file) of how the program works and all that it does. Tracks visits with student, teacher, parent etc and services in the ASCA model. Compatible with Windows & IOS!Note: When updating the settings, can
Grades:
PreK - 12th, Higher Education, Adult Education, Staff
SIPPS Data Collection Sheets
Great way to organize your data for classroom, specialists, school, or district. Streamline data by class or school Mastery Assessments for all levelsBeginning Extension Plus ChallengeColor coded to match SIPPS levels Mastery Assessments for all levelsBeginning Extension Plus Challenge Use this data to create SIPPS Intervention and Mastery Test Documentation for All Levels --Beginning, Extension, Plus and Challenge. Groups of students can be followed for regrouping purposes and progress monitori
Subjects:
Grades:
K - 12th
Excel Lessons - Creating Charts
No Prep! These lessons are great as a first Excel Chart lesson or for students already a little familiar with creating charts. Students love the data for these charts because the data is centered around things they love – their cell phones! In Lesson 1, students will create 5 different charts from step-by-step directions which include Chart Titles, Chart Styles, Axis Titles, Data Labels, and Moving Chart to its own Sheet.In Lesson 2, students will create 5 charts from provided data as well as ch
Grades:
5th - 12th
Types:
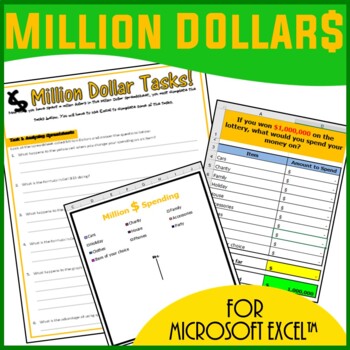
Excel Spreadsheets Million Dollars Activity
This resource allows students to understand the following: How graphs change when spreadsheet data is alteredUse of SUM() functionsHow graphs are madeComponents of a graphAdvantages of spreadsheets over pen and paper methodsStudents use this resource to understand how altering data in spreadsheets allow graphs to change. They understand such concepts by trying to spend a Million Dollars in a minute. Students are then expected to complete the associated worksheet which accompanies the spreadsheet
Grades:
5th - 12th, Adult Education
Types:
2nd Grade RTI Documentation Forms | Math Intervention Tracking Sheets
Everything you need to track student progress and keep you RTI efforts organized! This file includes printable graphs and recording sheets for every step of the math intervention process. This resource pairs perfectly with our 2nd Math Intervention Bundle.Use these forms to track RTI progress and provide documentation for parents and administration. There is a breakdown of how to use each form and tips and suggestions for filling each sheet out. There is also a digital option for tracking the in
Subjects:
Grades:
2nd - 7th, Higher Education
Types:
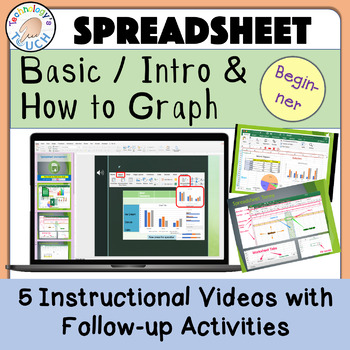
Spreadsheet - Basics Introduction & Graphing (Excel and Google Sheets)
This lesson guides students via animation and a tutorial video before completing the assignments. This is completely paperless with no prep, and lessons are done on either Microsoft Excel or Google Sheets. Students learn to enter data and start graphing. This resource is intended for learners first starting out or those who need a reminder on using spreadsheets or creating graphs. If you want your students' research papers to include eye-catching graphs, give this lesson a try. Start the slides
Subjects:
Grades:
1st - 8th
Types:
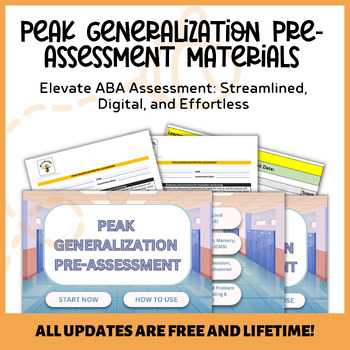
PEAK Generalization Pre-Assessment Materials with Script and Scoring Guide
Introducing the PEAK Generalization Pre-Assessment, now available in a user-friendly digital format, designed with your needs in mind for ABA therapy. This comprehensive package covers a wide range of assessments, including Foundational Learning, Basic Social Skills, Basic Verbal Comprehension, Memory, Advanced Social Skills, Advanced Verbal Comprehension, Basic Problem Solving, and Advanced Math Skills.Our program includes essential tools like an assessor script and a scoring guide, convenientl
Grades:
PreK - 12th
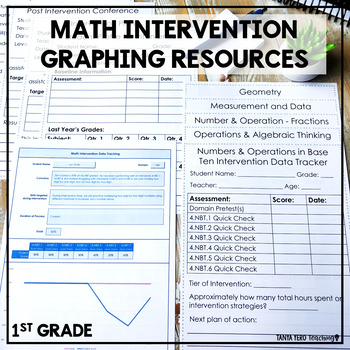
1st Grade RTI Documentation Forms | Math Intervention Tracking Sheets
Everything you need to track student progress and keep you RTI efforts organized! This file includes printable graphs and recording sheets for every step of the math intervention process. This resource pairs perfectly with our 1st Math Intervention Bundle.Use these forms to track RTI progress and provide documentation for parents and administration. There is a breakdown of how to use each form and tips and suggestions for filling each sheet out. There is also a digital option for tracking the in
Subjects:
Grades:
1st - 7th, Higher Education
Types:
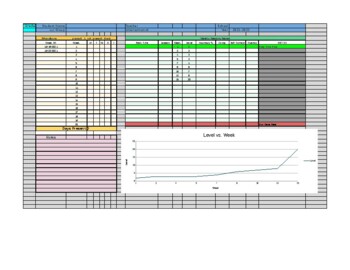
LLI Student Data Form
This was created for the LLI teacher (interventionist) to track ongoing data for each LLI student and be able to communicate achievement with classroom teachers and administration. It will calculate attendance and the graph is set to show week vs. level. Nothing is locked so you can change whatever you would like.I made a tab for each student. This contains only one sheet to be duplicated and used for one LLI class.At the bottom of the excel sheet is a link to open and make a copy in google sh
Subjects:
Grades:
K - 8th
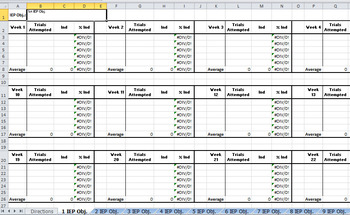
Progress Monitoring Data Collection UPDATED 1-2-2017
Use this excel spreadsheet to monitor student progress. Monitor up to 10 goals in one spreadsheet. Includes a directions page to show you how to setup your progress monitoring spreadsheet. All you need to do is enter the raw data, then the spreadsheet will calculate the percentage, graph the data, and enter the percentages onto a nine weeks sheet. It is great for showing parents the progress their child is making. It is also great to guide your lessons.
UPDATED 1/2/2017:
Fixed graphing gliches
Grades:
PreK - 12th
Types:
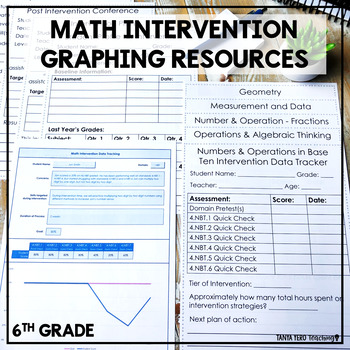
6th Grade RTI Documentation Forms | Math Intervention Tracking Sheets
Everything you need to track student progress and keep you RTI efforts organized! This file includes printable graphs and recording sheets for every step of the math intervention process. This resource pairs perfectly with our 6th Math Intervention Bundle.Use these forms to track RTI progress and provide documentation for parents and administration. There is a breakdown of how to use each form and tips and suggestions for filling each sheet out. There is also a digital option for tracking the in
Subjects:
Grades:
6th - 7th
Types:
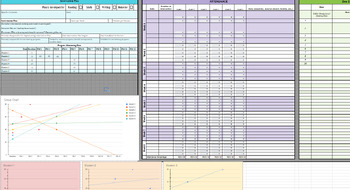
MTSS Intervention Tracking Sheet Tier 2 and 3
This sheet is a great way to keep track of student data such as progress monitoring, attendance, and notes from meetings about each group. It also provides a group graph based on your input of data and individual student graphs. This makes it easy to see who is not growing at the same rate as others. I am a MTSS lead at my school and created this to use and other schools in the district has used it as well as professors from the local university in their teacher prep program.
Subjects:
Grades:
PreK - 12th, Staff
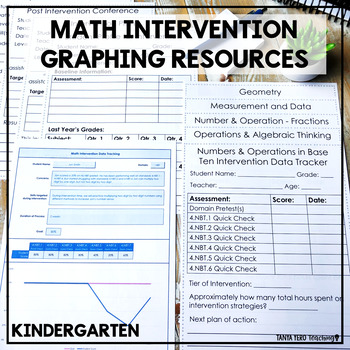
Kindergarten RTI Documentation Forms | Math Intervention Tracking Sheets
Everything you need to track student progress and keep you RTI efforts organized! This file includes printable graphs and recording sheets for every step of the math intervention process. This resource pairs perfectly with our Kindergarten Math Intervention Bundle.Use these forms to track RTI progress and provide documentation for parents and administration. There is a breakdown of how to use each form and tips and suggestions for filling each sheet out. There is also a digital option for tracki
Subjects:
Grades:
K - 7th
Types:
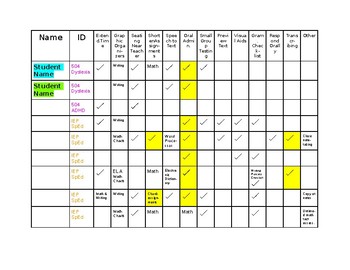
Accommodations "Cheat Sheet"
Take the information from your students' 504s and IEPs, and fill them in on this editable table to have on hand! You can also convert it to a Google Doc and share it with specials teachers or any other teachers that work with your kiddos.
Grades:
PreK - 12th
Intervention Coach Workbook - 11 Customizable Spreadsheets
✴️Establish CONSISTENT, TRANSPARENT procedures for your school-wide intervention system!✴️⛓ Find us on Linktr.ee @MorganLearning ⛓⭐ Companion Links ⭐⚙️ Video Preview: COMING SOON!⚙️ Tutorial Video: YouTube✍️ Blog Post: Morgan Learning Blog⭐ School-wide Intervention Systems & Tools ⭐ ✍️ School Wide Intervention Schedule✍️ Student Assistance Team (Intervention Team) Meeting Record✍️ Class & School-Wide Behavior Benchmarking System✍️ Data Analysis & Intervention Scheduling Plan ✍️ Schoo
Grades:
PreK - 12th, Staff
Types:
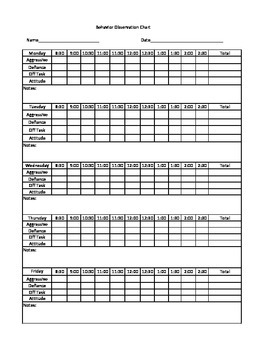
Behavior Monitoring Chart
This is an excel chart (Sorry there is no beautiful cover page) to monitor behavior. I have included the 4 most commonly monitored behaviors. Defiance, Off Task, Aggression, and Attitude.
Use tally marks to count how many times a day the behavior is acted out. Use this for IEP Meetings, RTI meetings, students transitioning in from ESE classroom setting to General Education, and for classroom data.
The behavior specialist will appreciate any data that you have recorded as well.
Grades:
PreK - 12th

Parabola Transformations - Interactive
A handy guide to help new students learn how each change affects the shape and direction of parabolas. Clear color coding for the various pieces of the formula and instant updates help separate and isolate the concepts for easy, intuitive learning.Enter information using simple dropdown menus and organized blank fields to isolate each piece of the formula!Two tabs:One allows you to enter individual pieces of information to show the resulting formulaOne allows you to enter the formula to show the
Subjects:
Grades:
7th - 12th, Higher Education, Adult Education
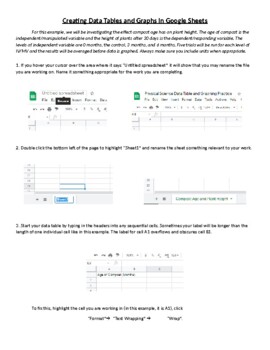
Creating Data Tables and Graphs in Google Sheets
This is an activity that walks students through the process of organizing and entering data into a data table and then using that data to generate line, bar, and pie charts. Once the graphs are generated, the process of formatting and editing the different parts of each graph is explained.
Showing 1-24 of 208 results

