76 results
4th grade graphing resources for Microsoft Excel
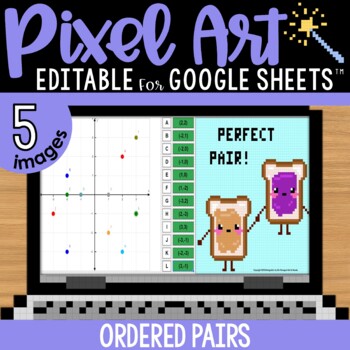
Ordered Pairs Graphing Coordinate Plane Pixel Art Math | 5 Images | Editable
Ordered pairs mystery pixel art with a doubles / perfect pairs theme! Have students practice finding the location of a coordinate pair on a graph to AUTO-GENERATE one of 5 pixel art images in Google™ Sheets (or Microsoft Excel™) plus a "secret message."★ Low Prep: Just assign the sheet in Google Classroom. Each sheet includes all 5 images; students click the tabs at the bottom to advance to the next pixel image. There are 12 math problems per image to solve.★ Differentiated: Includes 4 versions
Grades:
4th - 5th
Types:
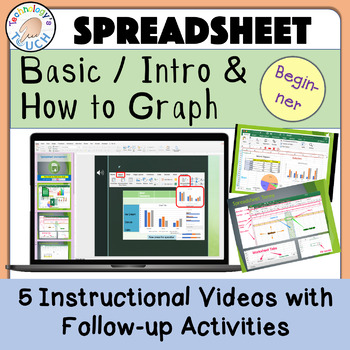
Spreadsheet - Basics Introduction & Graphing (Excel and Google Sheets)
This lesson guides students via animation and a tutorial video before completing the assignments. This is completely paperless with no prep, and lessons are done on either Microsoft Excel or Google Sheets. Students learn to enter data and start graphing. This resource is intended for learners first starting out or those who need a reminder on using spreadsheets or creating graphs. If you want your students' research papers to include eye-catching graphs, give this lesson a try. Start the slides
Subjects:
Grades:
1st - 8th
Types:
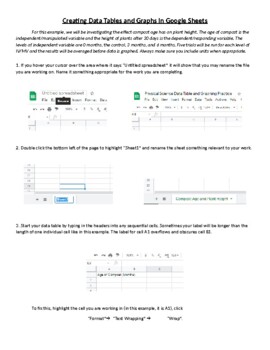
Creating Data Tables and Graphs in Google Sheets
This is an activity that walks students through the process of organizing and entering data into a data table and then using that data to generate line, bar, and pie charts. Once the graphs are generated, the process of formatting and editing the different parts of each graph is explained.
Weather Tracking in Excel
Compatible with Google Sheets, Google Classroom, or as a stand-alone file on a PC, this product is a must have for any teacher comparing weather conditions in multiple locations!
BEFORE YOU BUY: This file is part of a larger unit. Save yourself money by purchasing the Super Science Set for Weather and Climate nstead of buying each file separately.
Purchased alone, you get:
⭐ An Excel workbook that enables students to track the weather for 5 different locations as a whole class or individ
Subjects:
Grades:
4th - 8th
Types:
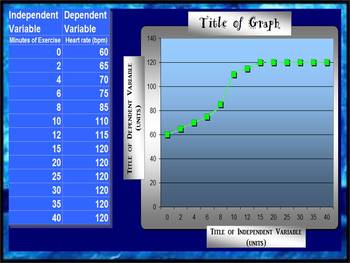
LINE GRAPH MAKER (AUTOMATIC)
This spreadsheet allows you to insert your independent and dependent variables into a chart and voila!... a line graph is generated as you enter in each piece of new data! Students love to take their data from a lab and watch as a graph is made right before their eyes! You can change all of the titles on the chart and the graph to suit your classes laboratory experiment needs! Students can easily print out their data to include in their lab reports!
Grades:
2nd - 12th
Types:
Excel Graphing Summer Fun with Digital Student Directions
The last marking period of the school year can be a challenging time to keep students engaged…they’re thinking about summer…you’re thinking about summer…#embraceitThis Summer Fun Excel project can be a perfect way to:* integrate technology* extend and enrich a math topic of study* introduce students to creating sheets and charts using ExcelProject file includes:* teacher notes/ classroom management suggestions* digital survey, using a Google Form, to collect summer activities data* digital stude
Subjects:
Grades:
3rd - 6th
Types:
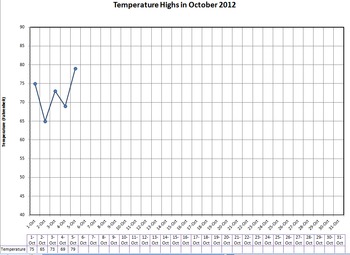
Graph Daily Temperature - with handout
Lots of downloads, are there any comments or votes for me? :)
Type in the daily temperature on your computer with your students and it will automatically graph it for you as you type. You can pre-print the monthly graph for everyone in your class and they can follow along and graph with you. I use it with calendar math or other daily activities.
Great for explaining the scales of a graph and practicing accuracy in graphing and using rulers to connect lines. Look for trends in weather and a
Subjects:
Grades:
3rd - 6th
Types:
Spreadsheet Basics 3 - Graphing
Help your students increase their ability to access and analyze information by learning to create graphs from computer spreadsheets with Spreadsheet Basics - Graphing. This resource is no prep, with narration and instructional videos that will help you foster critical thinking and problem solving skills. The only thing your students will need is the link to the resource to begin learning important new skills.Please look at the Preview and Video to take a closer look!This online activity is bro
Grades:
4th - 7th
Also included in: Custom Bundle for Danielle A.
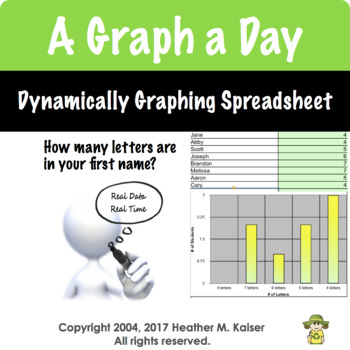
Daily Graph
If you want to integrate technology in a meaningful way, try using the daily graph questions that generate a graph in real time as students respond. This fully editable product works in Numbers, Excel, and Google Sheets.
When downloaded, this Excel spreadsheet contains 180 questions for students to answer. The teacher types their student roster 1 time. As students respond the graph is created dynamically. Teachers can customize the prompts and can upload the file as a Google Sheet that can
Grades:
3rd - 5th
Types:
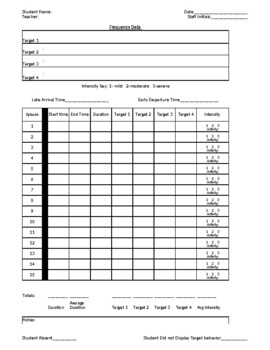
Behavior Frequency Rate Chart w/ Target, Intensity, Duration, BIP chart/Summary
Behavior Frequency Rate Chart (dates and chart cant be edited and dates changed to current year or target)--Daily Sheet-Date Entry-Intensity Chart-Duration Chart-Target Charts-BIP Evaluation printout -BIP write upSee preview for description Excel format for editing - tabs at bottom of page for easy change of view and data entry
Subjects:
Grades:
PreK - 12th
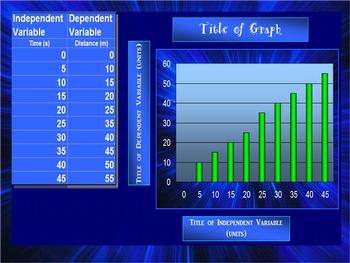
BAR GRAPH (AUTOMATIC)
This spreadsheet allows you to insert your independent and dependent variables into a chart and voila!... a bar graph is generated as you enter in each piece of new data! Students love to take their data from a lab and watch as a graph is made right before their eyes! You can change all of the titles on the chart and the graph to suit your classes laboratory experiment needs! Students can easily print out their data to include in their lab reports!
elementary science class, middle school sc
Grades:
2nd - 12th
Types:
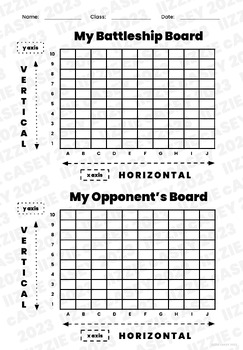
Coordinate Grids for Battleship and Spreadsheet Practice
I used this resource to teach 2nd and 3rd graders how spreadsheets and coordinate grids work! We played Battleship with them.
Subjects:
Grades:
2nd - 6th
Types:
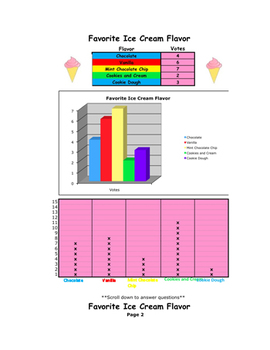
Favorite Ice Cream Flavor: Making Bar Graphs and Line Plots in Excel
This file is a great introduction to Excel for students in 2nd, 3rd, and 4th grade. It will give students practice entering data into a simple spreadsheet and making a line plot. A bar graph will automatically be generated when the students enter the data. They will then have to answer three questions by typing the answers in a box. Save this file to a shared drive so that all students can access it on their own computer. The tabs at the bottom allow you to click back and forth between the pages
Subjects:
Grades:
2nd - 4th
Spreadsheet Interactive Lesson {6.SP.4}
Looking for step by step instructions for interactive note booking using spreadsheets? This file is exactly what you need! There are complete instructions for notebook organization and how students use a self assessment stop light graphic organizer to communicate their comprehension of the lesson. This lesson includes complete instructions and student black line masters. There are also pictures of sample pages. My student's favorite part of this lesson is entering the data on computers and creat
Subjects:
Grades:
4th - 8th
Types:
CCSS:
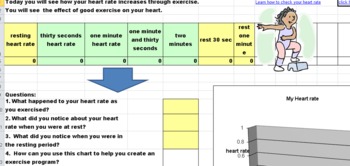
How can exercise effect your heart rate? -formulas, hyperlinks, andvideo
This spreadsheet is filled with an interactive graph based on real data that your students put into the spreadsheet. Their are hyperlinks for students to use (video and text for differentiation) to learn how to check their pulse. This would be a great lesson to complete for a heart healthy unit, or just to teach kids to stay active during wintery weather.
There are follow up questions that are at the bottom of the spreadsheet that will help them analyze their own data. Kids will love this les
Grades:
2nd - 6th
Types:
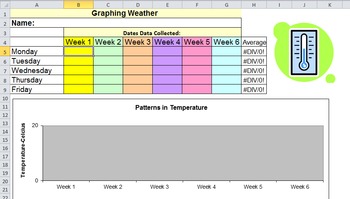
Weather Graph
This Excel spreadsheet can be used as a whole group activity, or as an individual activity. Students enter daily temperature. The sheet automatically graphs the data. There are seven sheets. One sheet is for data collected daily over six weeks. The other sheets are from collecting data each day on a monthly basis. The monthly sheets are automatically set to average the weekly temperature. Some cells are locked to prevent younger students from accidently deleting labels, etc. Each sheet can be pr
Subjects:
Grades:
K - 7th
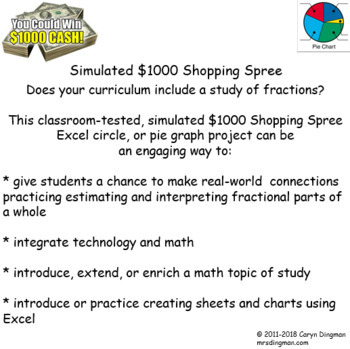
Excel Graphing $1000 Simulated Shopping Spree
Does your curriculum include a study of fractions?This classroom-tested $1000 Simulated Shopping Spree Excel circle, or pie graph project can be an engaging way to:* give students a chance to make real-world connections practicing estimating * interpret fractional parts of a whole in a way that's personal and unique* integrate technology and math* introduce, extend, or enrich a math topic of study* introduce or practice creating sheets and charts using ExcelThis classroom-tested project file in
Subjects:
Grades:
4th - 6th
Types:
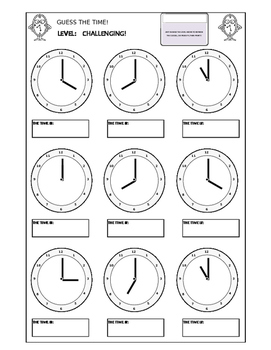
Clocks - Guess The Time
An easy way to produce hundreds of clock worksheets so that your students can practice working out the time. This is an Excel worksheet with 9 clocks, that refresh randomly to produce any number of random print outs.
There are three levels (Challenging, Really Hard, and Nightmarish!), corresponding to Easy (K, G1), Medium (G2, G3) and Hard (G4, G5). You only have to change levels or refresh the page (F9 for a PC) and you have a new sheet.
Tab 1 ("GUESS") is for guessing the time from a clock.
Subjects:
Grades:
K - 7th
Types:

Easy Math Classroom Assessment Tracker - Excel Bar Graph Formulas Pre-Loaded
This Excel file includes classroom Math proficiency trackers for schools with Pre-Tests, two or three Benchmark Assessments, and a Post-Test compared to district averages. I've also included a how-to tab and a completed example.
The file defaults to a Galileo Achievement tracker... but it is easy to edit the text if your school conducts other standardized assessments.
In just two easy steps you'll have a great visual prepared for your students:
Step 1: Enter data in the % Proficient boxes
St
Subjects:
Grades:
1st - 8th
Types:
Graphing in Excel with Skittles Digital
This is a unit on graphing using Skittles. Excel is a powerful tool for graphing since it is easy to use and simple to change your graph. It gives step by step instructions to the students so they can graph easily.Students love graphing with Skittles and even learning information on the Skittles website!This is by CC Fisher.
Grades:
3rd - 6th
Types:
Also included in: Microsoft Excel Bundle of Treasures! Digital
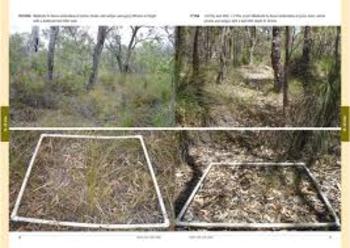
Ecology Lab: Micro-Plot sampling and graphing
Combined with field work (access to a forest is required), students collect data, and then return to class to use the data in two separate graphs. They create a paper-and-pencil graph, and they follow a set of detailed instructions to use their data in order to complete a graph using Microsoft Excel.
Subjects:
Grades:
4th - 6th
Types:
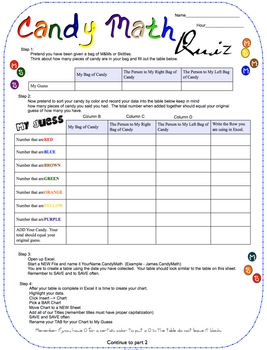
Candy Math Quiz for Grades 3-8
This quiz is a fun way to assess your students in their chart making skills in Excel along with their problem solving skills.
Part 1 of the quiz students are to pretend they have been given a bag of candy. They are to create a table then a chart with their data.
Part 2 of the quiz you give your students candy and this time they have to record the actual amount and make a table and a chart.
Part 3 of the quiz test basic formula writing.
Common Core - 3.MD.3. Draw a scaled picture graph and
Subjects:
Grades:
3rd - 9th
Types:
Excel Graphing Halloween Trick-or-Treat
Homework?? On Halloween?? Seriously??!!This Halloween Trick-or-Treat Excel Project, updated July 2018, can be an engaging way to:* integrate technology* introduce, extend, or enrich a math topic of study* introduce students to creating sheets and charts using Excel* give students a chance to graph their Halloween goodies collected in a way that’s real and relevant! This classroom-tested Halloween Excel project file includes: * student project directions sheet, in checklist form * rubric to score
Subjects:
Grades:
3rd - 6th
Types:
Excel Graphing Classroom Birthdays with Digital Student Directions
Give your students a chance to get to know their classmates, comparing their birthday celebration data in a way that's real and relevant!This Class Birthdays Excel Project can be an engaging way to:* integrate technology* introduce, extend, or enrich a math topic of study* introduce students to creating sheets and charts using ExcelThe classroom-tested product file includes:* class survey, using Google Forms, to find out the month in which each student celebrates a birthday* student project dire
Grades:
3rd - 5th
Types:
Showing 1-24 of 76 results


