BAR GRAPH (AUTOMATIC)
Science Girl
378 Followers
Description
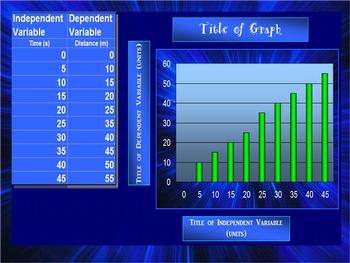
This spreadsheet allows you to insert your independent and dependent variables into a chart and voila!... a bar graph is generated as you enter in each piece of new data! Students love to take their data from a lab and watch as a graph is made right before their eyes! You can change all of the titles on the chart and the graph to suit your classes laboratory experiment needs! Students can easily print out their data to include in their lab reports!
elementary science class, middle school science class, graphing, recording data, excel spreadsheet
elementary science class, middle school science class, graphing, recording data, excel spreadsheet
Total Pages
Answer Key
N/A
Teaching Duration
N/A
Report this resource to TPT
Reported resources will be reviewed by our team. Report this resource to let us know if this resource violates TPT’s content guidelines.


