24 results
Free 7th grade graphing resources for Microsoft Excel
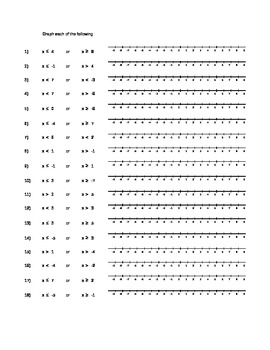
Compound Inequality Graphing Practice
This excel spreadsheet includes a sheet of practice for both AND and OR compound inequalities. There are also three sheets of blank number lines, so that a teacher could write their own inequalities for students to graph.
Grades:
5th - 9th
Types:
Manage Sports Statistics in Google Drive / Google Sheets - Activity
Use Google Sheets to analyze sports data
This activity lets students practice several fundamental spreadsheet skills, including:
-renaming documents
-adding formulas
-inserting / formatting charts
Screenshots demonstrate how to do all of the above in Google Sheets, the spreadsheet application in the Google Drive suite. You can add additional statistics to customize the assignment for your students and adjust the level of difficulty.
Aligned to the following Massachusetts Technology Literacy
Grades:
5th - 8th
Types:
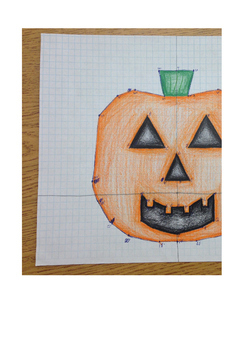
Pumpkin Transformations
This is a fun, artistic activity involving graphing on the coordinate plane, translations, and reflections. It is a great activity after translations and reflections have been taught, and best for doing in the
fall as the outcome is a pumpkin.
It could also be used as an assessment.
Materials needed: pencil, graph paper, crayons/markers/colored pencils.
Grades:
7th - 9th
Types:

Rapunzel Coordinate Plane Picture
Students will graph the ordered pairs and connect them to create a Rapunzel picture. Uses all 4 quadrants on the coordinate plane. Can be used as an extra credit project or a way to practice graphing ordered pairs.
Subjects:
Grades:
6th - 8th
Types:
CCSS:
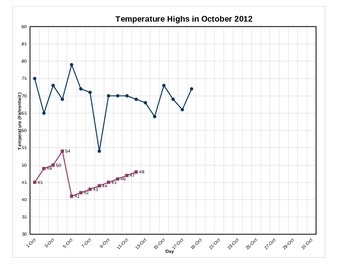
Graph Daily High and Low Temperatures - with handout
Per a few requests, I have added the capability to graph the low temperatures as well as the high temperatures.
Type in the daily temperature on your computer with your students and it will automatically graph it for you as you type. You can pre-print the monthly graph for everyone in your class and they can follow along and graph with you. I use it with calendar math or other daily activities.
Great for explaining the scales of a graph and practicing accuracy in graphing and using rulers t
Subjects:
Grades:
4th - 7th
Types:
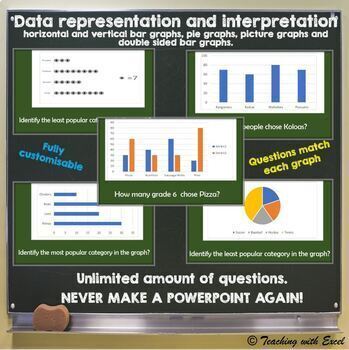
Data representation and interpretation - With Answers UNLIMITED QUESTIONS
Get your students engaged and save yourself time while practicing Data representation and interpretation. Data and Graphing unlimited questions with answers can be used for revision, concept practice, game questions, warmups and many other areas. No more hours prepping slideshows that will only last 5 minutes, this sheet can do it for you when you Simply Click. With little to no effort you have the control to enter the types of data representation and interpretation questions would like to see
Grades:
3rd - 8th
Also included in: Year 6 Maths Bundle Unlimited Questions
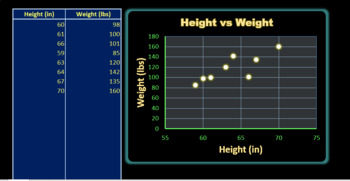
Interactive Excel Scatter Plot Maker - Editable
With this document, you can create scatter plots in real time with your class. The file uses Microsoft Excel's graphing ability to make a scatter plot. All you have to do is name the axes, add data (up to 500 pairs of numbers), and then name your graph. The file is editable in Excel and can be altered in any desired way (colors, format, etc.). To name the axes, edit the title at the top of the data table and the graph will automatically update.To name the graph, double click "[Title]" and enter
Grades:
4th - 10th
Types:
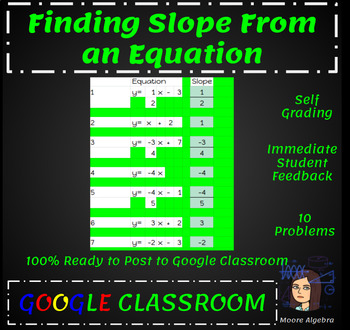
Finding Slope From an Equation
10 equations are given in slope intercept form for students to identify the slope.Self-Grading, the answers will turn green/blue if they are correct. You only have to look at the thumbnails in Google Classroom to see they are correct.To see the correct answers, you can go to format - conditional format. I would not do this around your students, or they will see how they can cheat.
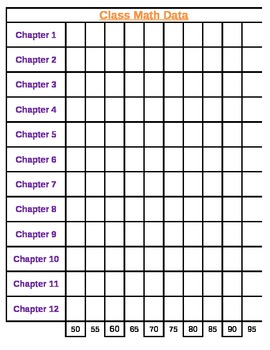
Math Class Data Sheet
Great for a class Data Wall!
This is an excel spreadsheet used to track yearly growth.
Enjoy!
Subjects:
Grades:
K - 12th

Using Spreadsheets to Investigate Candy Color and Size Distribution
Hi Teachers! In this project, students practice with entering and formatting candy size and color data, making basic spreadsheet formulas, and using the SUM, AVERAGE, and COUNTIF functions. Students may also practice making 2D or 3D pie charts based on the %s of sizes of candies, and the %s of colors of the candies. Material expenses include a bulk bag of small Wonka Nerds boxes, small Ziploc-style baggies, and Sharpies. This could be modified to involve only color data of other candies, such as
Grades:
4th - 7th
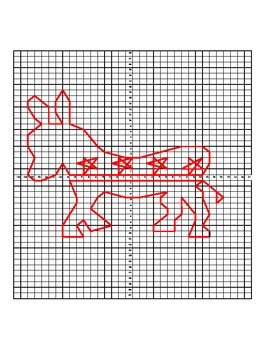
Election Day - Dem - Cartesian Cartoon
You will receive a three-sheet excel document. One sheet is a set of coordinates that will create the DEMOCRAT DONKEY SYMBOL. The coordinates are arranged so that when you print, you will have two student copies on one sheet. The second sheet is a blank graph paper made in excel. The third sheet is an answer key showing what the graph is supposed to look like.
This graph is good for election day fun and inauguration day fun depending on who wins, of course.
Subjects:
Grades:
5th - 9th
Types:
Free Tree Measurement Data
Teaching circumference and diameter conversions? Teaching graphing or data literacy? Here is dataset of 50 trees you can use to explore! Excel file includes #, diameter of tree, and whether it is a deciduous or coniferous. It's an easy way to use real science data in the classroom. Goes great with Tree Measuring Lab.
Subjects:
Grades:
6th - 10th

Function Input/Output Table
Use this form to help students organize information when teaching how to graph an equation or function. Pair this with a coordinate plane pdf from leading math worksheet sites for a simple worksheet on graphing.
I use this method before teaching slope/intercept form so the students see the connection themselves.
In excel so its easily editable for your preference.
Grades:
7th - 10th
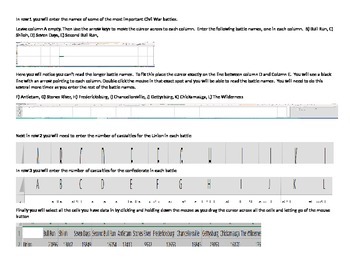
Civil War Stats Excel graphs
This student handout goes step by step so that students can easily create graphs of the Civil War Battles and Causalities. Should accompany my Civil War Scrapbook and the Civil War Notes Packet.
Subjects:
Grades:
5th - 8th
Types:
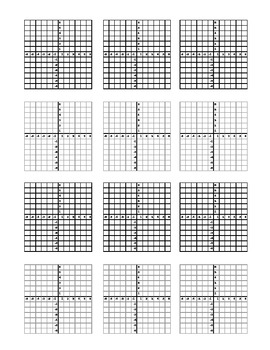
Excel Graph Paper Coordinate Grid
This excel document was created to help me with all of my graph paper needs. There are several tabs with various arrangements of coordinate grids. Various sizes are included for various needs. These work great as homemade practice worksheets for as cut-and-paste to make a worksheet. All grids are x-y coordinate grids.
Subjects:
Grades:
5th - 12th

Pictograph Fun For All Ages
This is an excel document for busy teachers whom are trying to teach students to read picture graphs. The teacher will be able to edit the document as pleased. Two sheets are created and the format is very easy to use. It can also be used with the smart board in the classroom.
Grades:
PreK - 12th
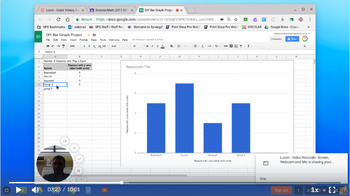
DIY Bar Graph
In this lesson students learn how to make a bar graph in google sheets using google classroom. I had previously taught them how to make these on paper, and now they can upload their data from their graphs on graph paper, and use it to create a bar graph in google sheets.
I did find that many students were accidentally deleting their graphs, so on the second day I had them watch me create a chart after highlighting the data table. Also make sure you set it up so that it makes a copy for each st
Subjects:
Grades:
5th - 8th
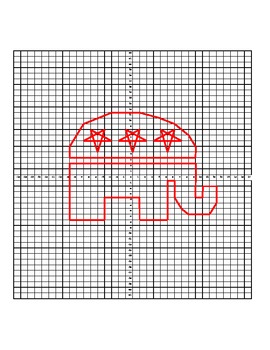
Election Day - Rep - Cartesian Cartoon
You will receive a three-sheet excel document. One sheet is a set of coordinates that will create the REPUBLICAN ELEPHANT SYMBOL. The coordinates are arranged so that when you print, you will have two student copies on one sheet. The second sheet is a blank graph paper made in excel. The third sheet is an answer key showing what the graph is supposed to look like.
This graph is good for election day fun and inauguration day fun depending on who wins, of course.
Cartesian cartoons are a fun w
Subjects:
Grades:
5th - 9th
Types:
Excel Graph Paper Miscellaneous
This excel file includes graph paper other than coordinate grids. Number lines, 3 space graphing, 100 boards (good for percentage shading) and coordinate graphing with x-y tables are included in this spreadsheet.
Grades:
5th - 12th
Types:
Demonstrate Acute, Right, Obtuse, Straight Angles with an Animated Excel File
Simple to use animated Excel file for in class demonstration of acute, right, obtuse, and straight angles. Move scroll bars, select option buttons, type numbers, and watch these mathematical concepts come alive. You must use Microsoft Excel that is capable of opening file formats in either .xlsx or .xlsm.
Grades:
6th - 12th
Types:

Stock Market Investment Ledger
This document allows students to select and research stock information in order to make informed decisions about how to invest their money.
Subjects:
Grades:
7th - 9th
Types:
Speed Lab Baseball and Softball with MPH conversion Graphs
Take the data from the Speed Lab Baseball and Softball and "Graph it"
Bar Graphing
Subjects:
Grades:
6th - 11th
Types:
Activity Running Record
This document is available to use to track the things that you are sending home to your students who needs things individualized.
Subjects:
Grades:
PreK - 12th
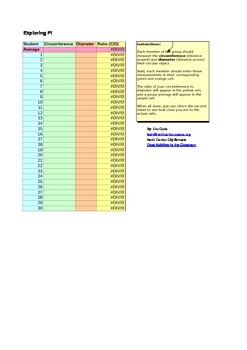
Exploring Pi
Free excel DOC to go with Relationship of Pi Activity
Also check out Cirlces Foldable
Grades:
5th - 9th
Types:
CCSS:
Showing 1-24 of 24 results


