331 results
7th grade graphing resources for Easel

Four Quadrants of the Coordinate Plane Digital Escape Room 6th Grade Math
Can your students solve problems in all four quadrants of the coordinate plane in order to recover stolen diamonds? Students will race through a train station following clues, plotting points, solving word problems, as they go undercover to recover the goods stolen in a diamond heist. This online breakout is based on 6th grade math standards. They'll need to be quick reflecting points across the x-axis, finding the distance a point lies from the y-axis, finding the distance between points, and p
Subjects:
Grades:
5th - 7th
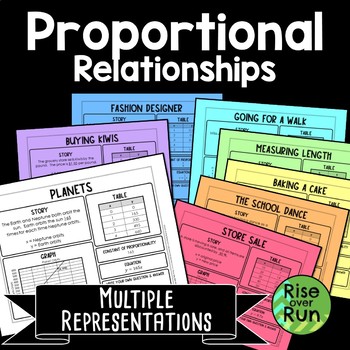
Proportional Relationships Graphing with Multiple Representations
These multiple representation math tasks help students make connections between graphs, tables, equations, and real world scenarios. Students are given a little information and must think how to fill in the rest!8 activity sheets each include: a story a grapha tableconstant of proportionalityan equation a space for students to write their own question and answer. A blank template is included as well so students can create their own proportional relationship.Multiple representations are a great w
Grades:
7th - 8th
Types:
Also included in: 8th Grade Math Activities & Lessons Bundle for the Whole Year
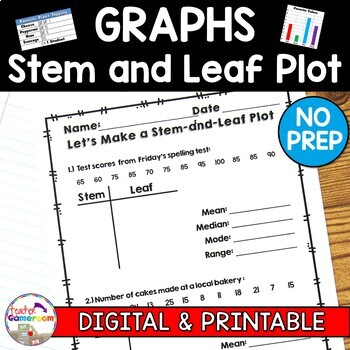
Making a Stem and Leaf Plot with Mean, Mode, Median, Range Worksheets
These worksheets allows students to make a stem and leaf plot using a given set of data. Student must build the plots on their own and then must find the mean, median, mode, and range of the data. There are 4 worksheets, each with 2 Stem and Leaf graphs to be made. Great for review or as a homework assignment. Full Page answer keys included. Extra licenses are $0.75.Questions/Materials include:✔️ 2 Questions per page✔️ 4 Worksheets✔️ 10 - 12 Numbers per graph✔️ 2-Digit and 3-Digit Numbers✔️ Rea
Grades:
4th - 8th
Types:
CCSS:
Also included in: Graphs Bundle | No Prep Digital Resources
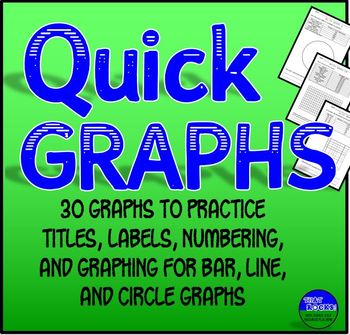
Graphing Practice 30 Quick Graph Sheets for Bar, Line, & Pie Graphs
Graphing Practice for Middle School! These are great to use as bellringers, exit tickets, or just extra practice, and work well for either a science class or math class.Using a data table, students supply the title, label the X- and Y-axes, practice finding appropriate number intervals, and make the graph. My average sixth grade students take 5 - 10 minutes per graph. The half-sheet format saves paper. Now available as ready-to-use EASEL activities!Each data table includes factual informatio
Grades:
5th - 8th
Types:

Writing Linear Equations in Slope Intercept Form Task Card Activity
Printable PDF, Digital & Easel by TPT Versions are included in this distance learning ready activity which consists of 10 Task Cards (with & without QR Codes) to help strengthen students’ skills in writing a linear equation in Slope Intercept form from a graph.Distance learning?No problem! This activity now includes Google Slides & Easel by TPT digital options!Explore the ⌨ Distance Learning in my store for more digital resourcesThree Forms of Use IncludedPrintable PDFGoogle SlidesEa
Grades:
7th - 9th
Types:
Also included in: 8th Grade Math Bundle ~ All My 8th Grade Math Products at 1 Low Price
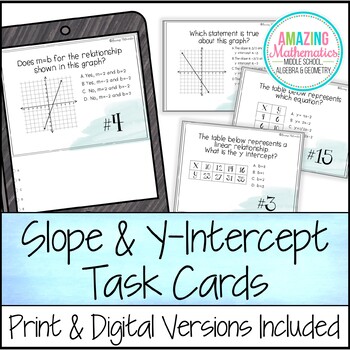
Slope and Y Intercept Activity Task Cards - PDF & Digital
8th grade students will love trying something different with these Slope & Y-Intercept Task Cards. They will keep them engaged all while practicing their understanding of slope in a variety of ways. Printable PDF, Digital & Easel by TPT versions are included in this distance learning ready activity which consists of a set of 15 task cards that cover the following skills:Determine slope and y intercept from graphs & tablesUnderstand the difference between proportional and non-propo
Grades:
7th - 10th
Types:
Also included in: 8th Grade Math Bundle ~ All My 8th Grade Math Products at 1 Low Price
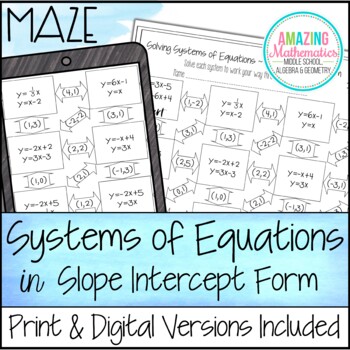
Solving Systems of Equations Maze - Slope Intercept Form - Solve by Graphing
Printable PDF & Digital Versions are included in this distance learning ready activity which consists of 11 systems of equations in slope intercept form that students must solve by graphing, elimination or substitution. Important InformationNot all boxes are used in the maze to avoid students from just figuring out the correct route. Students will have to correctly solve 8 systems in slope intercept form to complete the maze.Ways to Use this Maze1) Have students solve each system any way t
Grades:
7th - 10th
Types:
CCSS:
Also included in: 8th Grade Math Bundle ~ All My 8th Grade Math Products at 1 Low Price
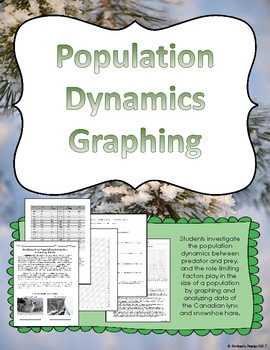
Predator and Prey Population Dynamics Graphing Activity
Students investigate the population dynamics between predator and prey, and the role limiting factors play in the size of a population by graphing and analyzing data of the Canadian lynx and snowshoe hare.I use this activity with my sixth grade students during our unit on ecosystems. We complete it as a class activity. You could make it an option in a choice project, a learning extension for higher level students, or an activity for a science center.The final page includes the completed graph
Grades:
5th - 8th
Types:
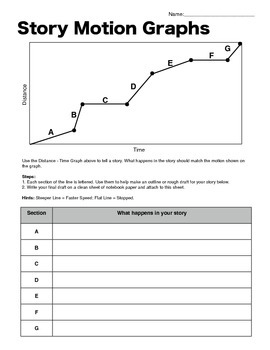
Story Motion Graphs - Distance-Time Graph Writing Activity
This writing activity will allow you to see how well students can interpret a distance-time graph, and let them use their imaginations as well.
Each section of the graph is labeled with a letter. In the table below, students can create an outline for their story that matches the motion graphed above. Then, they can write their final draft on a clean sheet. Even better: there is an advanced version for your higher-level thinkers. They must label the axis with units that match their story.
The
Grades:
5th - 8th
Types:
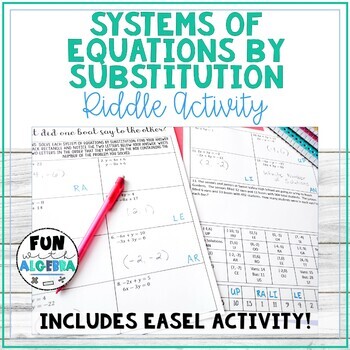
Solving Systems of Equations by Substitution Printable Algebra 1 Riddle Activity
Students will practice their skills solving 13 systems of equations by substitution using this riddle activity. Activity is self-checking, as students will know if they didn't do their problem correct when they do not see their answer on the answer chart on the back. Types of problems included:**3 equations: Both solved for y**2 equations: One solved for y**4 equations: Neither solved for y, but either x or y has coefficient of 1**3 equations: Neither solved for y, and neither x nor y has coeffi
Grades:
7th - 10th
Types:
Also included in: Systems of Equations Activity Bundle
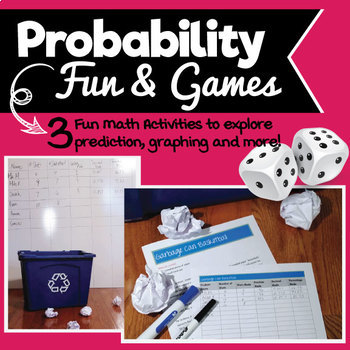
Probability Fun & Games! Exploring fractions, decimals, percentages & more!
Probability Fun & Games reinforces the concepts of: addition, prediction, graphing, fractions, decimals, and percents through three fun activities. Your students will be on the fast track to learning basic math skills. The packet include three activities - Roll Them Bones, Trash Can Basketball and What Color is Your Candy.
Included in this download are:
• Note to teacher with tips on using lessons
• Three activities with instructions
• Discussion prompts
• Ready-made charts for students to
Subjects:
Grades:
3rd - 8th
Types:
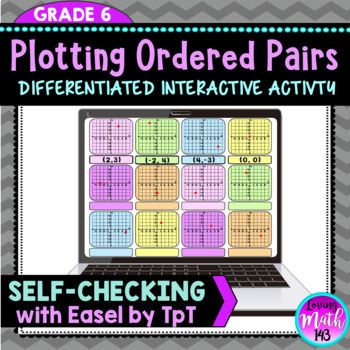
Graphing on the Coordinate Plane (4 quadrants) Self-Checking Digital Activity
Middle school math students will practice plotting ordered pairs on the coordinate plane. Students will plot 12 ordered pairs on the coordinate plane in all four quadrants. This activity is DIFFERENTIATED with two versions for your higher level and lower level students. Simply Create a Copy and delete the unnecessary slides depending on the population! ★BONUS FEATURE★This product is also available on Easel by TpT! This means, students can "Drag and Drop" their answers for a self-checking experie
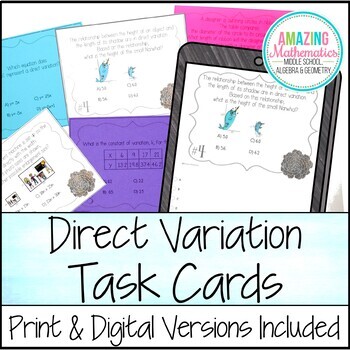
Direct Variation Task Cards - PDF & Digital
Printable PDF, Google Forms & Easel by TPT Versions are included in this distance learning ready activity which consists of a set of 18 Task Cards (with & without QR Codes) to help strengthen students’ skills in working with Direct Variation problems. To complete this activity students will have to be able to do the following:• Identify equations, graphs, & tables that represent a direct variation• Calculate the constant of variation from a table• Solve word problems involving dire
Grades:
6th - 10th
Types:
Also included in: 8th Grade Math Bundle ~ All My 8th Grade Math Products at 1 Low Price
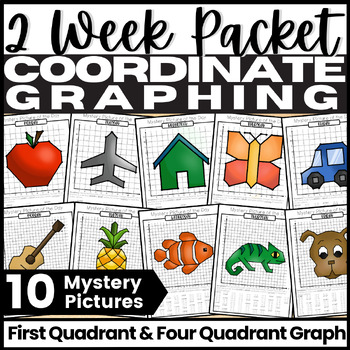
Coordinate Plane Mystery Pictures, First Quadrant and Four Quadrant Graph
If you're looking for highly engaging Coordinate Plane Mystery Pictures for your students, This. Is. It. This packet includes 10 Mystery Pictures and is differentiated by giving you the option of assigning Quadrant 1 Graph and/or all 4 Quadrants Graph. Get your students excited for math with this fun Coordinate Plane Mystery Picture of the Day Packet! This is a must-have packet for your Coordinate Graphing Unit. How is this Coordinate Plane Mystery Pictures Packet different from other Graphing a
Grades:
5th - 7th
Types:
CCSS:

Data Analysis and Graphing Worksheet Scientific Method Practice (Herons)
Students build GRAPHING and DATA ANALYSIS skills. This activity provides a data table and an incomplete bar graph related to nesting habits of herons. Students follow directions that lead them through foundational graphing and data analysis skills. Instruction is built into the worksheet. This activity builds the following skills:Setting up bar graphs, including choosing intervals, labeling axes, and writing graph titles.Using data to make a bar graph (with an example already in place).Pulling
Subjects:
Grades:
6th - 9th
CCSS:
NGSS:
MS-LS2-2
, MS-LS2-1
, HS-LS2-1
, HS-LS2-2
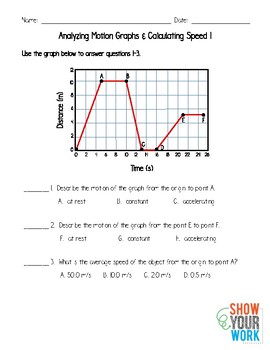
Analyzing Motion Graphs & Calculating Speed 1
This worksheet is a great addition to your Force & Motion unit for beginners! Students will analyze basic motion graphs (constant, at rest, accelerating), and calculate basic speed. Could also be used as a quiz.Now available as a self-checking EASEL ACTIVITY! Assign the Easel activity as practice and the hard copy worksheet as a quiz.Certified Easel Seller
Subjects:
Grades:
5th - 7th
Types:
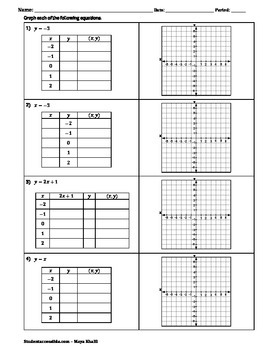
Graphing Linear and Nonlinear Equations with Tables of Values Worksheet
Two pages of graphing linear and nonlinear equations using tables of values. Some of these could be graphed with the slope and y-intercept. The equations are:y = -3 x = -3y = 2x +1 y = x y = x-squaredy = x-cubed y = |x| y = sqrt(x). The answer key is on pages 3 and 4.Make sure the printer does not shrink this resource. The preview above shows the answer key.
Grades:
7th - 10th
Types:
CCSS:
Dilations Initials Project - Project Based Learning with Digital Easel Activity
Dilations Initials Project.This is a culminating project for a unit on dilations. Students enlarge and shrink a drawing of their initials on grid paper or poster-board and use coordinate graphing rules to produce a similar image. In addition, they enlarge the image and it must have a scale factor of at least 4. Then they shrink the image and it must have a scale factor of at most 1/4. Good activity for project-based learning. Digital and Print: Includes an Easel Activity ready for learning with
Subjects:
Grades:
6th - 9th
Types:
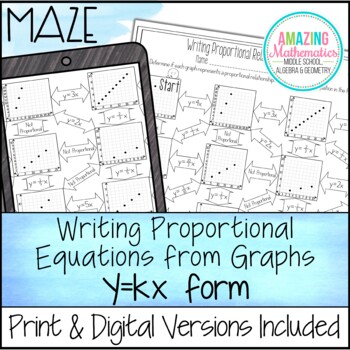
Writing Proportional Relationships From Graphs in y=kx Form Maze worksheet
Printable PDF, Google Slides & Easel by TPT Versions are included in this distance learning ready activity which consists of 11 problems where students must first determine if the graphs are proportional and then write the corresponding proportional equation in y=kx form. This maze will help strengthen your students’ skills at calculating the constant of variation (constant of proportionality) from a graph and writing the corresponding equation.Not all boxes are used in the maze to prevent
Grades:
7th - 8th
Types:
Also included in: 8th Grade Math Bundle ~ All My 8th Grade Math Products at 1 Low Price
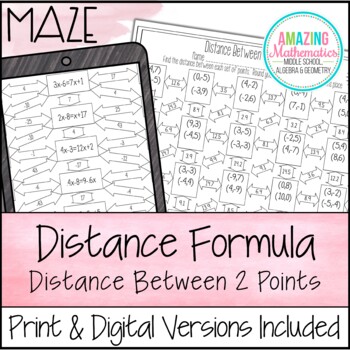
Distance Formula Worksheet - Maze Activity
Printable PDF, Google Slides & Easel by TPT Versions are included in this distance learning ready activity which consists of a maze where students will have to calculate the distance between two given points using the distance formula.Distance learning?No problem! This activity now includes Google Slides & Easel by TPT digital options!Explore the ⌨ Distance Learning in my store for more digital resourcesThree Forms of Use IncludedPrintable PDFGoogle SlidesEasel by TPTImportant Informatio
Grades:
7th - 10th
Types:
CCSS:
Also included in: Geometry Bundle ~ All My Geometry Products at 1 Low Price
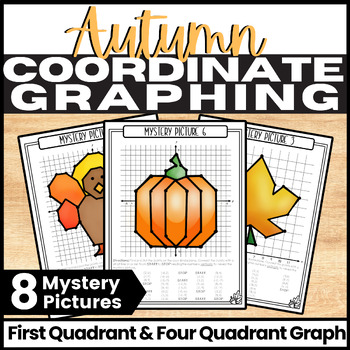
Coordinate Graphing Fall Mystery Picture, Quadrant 1 and 4 Quadrant graph
This fun and highly engaging Coordinate Graphing Mystery Picture Fall Packet will have all your students at their seats and eager to complete their picture during the entire math block! By plotting and connecting the ordered pairs on a Coordinate Grid students will reveal the Fall Mystery Picture. Each picture is available in a Quadrant 1 only graph and all 4 quadrants graph. This is a must-have seasonal resource for your math block.How will this packet benefit my students?A Mystery Picture is a
Grades:
5th - 8th
Types:
CCSS:
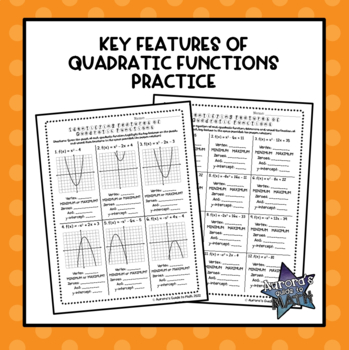
Key Features of Quadratic Functions
Key Features of Quadratic FunctionsThis no-prep resource is a great way to get students to practice identifying the key features of quadratic functions! This resource contains four pages of practice for a total of 28 practice problems! Each of the first three pages focus on a different representation of a quadratic (a page of graphs, a page of tables, and a page of equations). The fourth page contains multiple choice questions for test prep practice. This is a great way for students to practice
Subjects:
Grades:
6th - 12th
Types:
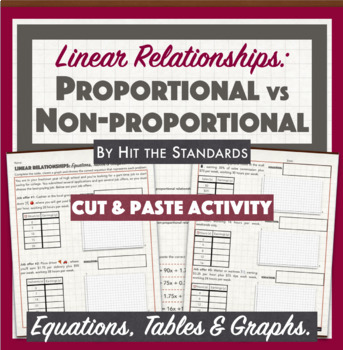
Proportional & Non-proportional Linear Relationships: Equations Tables Graphs
In this cut&paste activity, students must choose the best-paying job out of 5 given options. Each job salary represents a linear relationship, so students must complete a table, create a graph that represents each of them. Also, they must choose the correct equation (cut & paste) that represents each linear relationship. Finally, students must identify the relations as proportional or non-proportional. Hits CC Standards 7.RP.A.2, 8.EE.B.5, 8.F.B.4 & 8.F.B.5 Hits TEKS 8.4B, 8.5A, 8.5
Subjects:
Grades:
7th - 9th
Types:
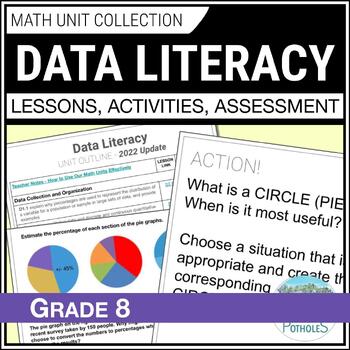
Grade 8 Ontario Data Management Unit Collecting Data Reading & Analyzing Graphs
Save time and reduce stress!! This UPDATED Data Literacy unit has EVERYTHING YOU NEED. It includes 3-part math Google Slides lessons, projectable slides for following along, taking notes, and creating anchor charts. It also includes practice worksheets, review activities, math centres, assessments, and Ontario math report card comments. Lesson Topics: Collecting and Organizing DataD1.1 - one and two-variable dataD1.2 - collect continuous dataBonus - Primary and Secondary DataBonus - Census and
Subjects:
Grades:
7th - 9th
Types:
Showing 1-24 of 331 results


