6 results
7th grade graphing lessons for Microsoft Excel
Excel Lessons - Creating Charts
No Prep! These lessons are great as a first Excel Chart lesson or for students already a little familiar with creating charts. Students love the data for these charts because the data is centered around things they love – their cell phones! In Lesson 1, students will create 5 different charts from step-by-step directions which include Chart Titles, Chart Styles, Axis Titles, Data Labels, and Moving Chart to its own Sheet.In Lesson 2, students will create 5 charts from provided data as well as ch
Grades:
5th - 12th
Types:
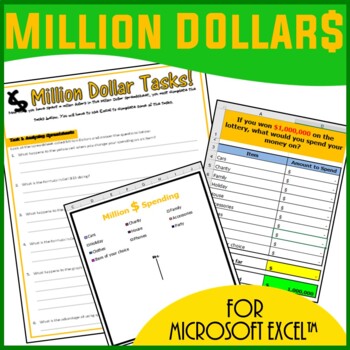
Excel Spreadsheets Million Dollars Activity
This resource allows students to understand the following: How graphs change when spreadsheet data is alteredUse of SUM() functionsHow graphs are madeComponents of a graphAdvantages of spreadsheets over pen and paper methodsStudents use this resource to understand how altering data in spreadsheets allow graphs to change. They understand such concepts by trying to spend a Million Dollars in a minute. Students are then expected to complete the associated worksheet which accompanies the spreadsheet
Grades:
5th - 12th, Adult Education
Types:
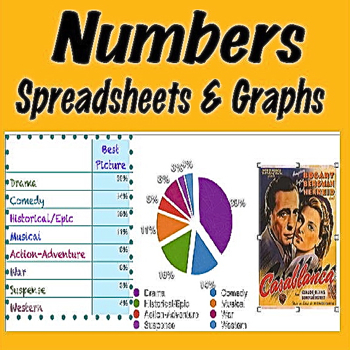
Numbers Spreadsheets and Graphs
The skills needed to create spreadsheets and graphs will stand students in good stead from junior high school through college and into their professional lives as adults. Start in 7th grade to teach your students how to create these data and math skills with Apple’s program called Numbers. And although, the assignments provided in this unit are written to take advantage of the tools available in Numbers, if you’re a Microsoft user, the ideas can be easily converted to Excel spreadsheets and g
Subjects:
Grades:
7th - 9th
Types:
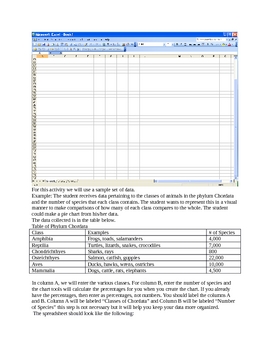
Creating Pie Charts with a Spreadsheet Program
This is a lesson/tutorial on how to create great looking pie charts using spreadsheet tools like MS Excel or Google Docs. Included is an independent practice section for students to complete and many visuals.
Grades:
7th - 12th
Types:
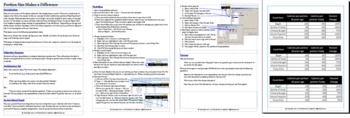
Portion Size make a Difference -Spreadsheet(Excel) Lesson
Most of us are aware of the obesity epidemic that is plaguing our youth. There are a whole host of reasons why this is. One reason is that our concept of what constitutes a portion of food has drastically changed. Food portions have gotten much larger, more than double in many cases, in the past 20 year. In this lesson we use actual data collected from the National Heart, Lung and Blood Institute website to explore these changes in a spreadsheet (I use MS Excel) . Depending on the age and abilit
Subjects:
Grades:
5th - 12th
Types:
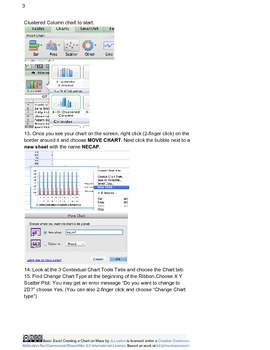
Basics of Excel: Working With Charts and Data on Macs
Step by Step lesson on creating charts, sorting and manipulating data in Excel Mac Version. This is a lesson for teachers trying to use assessment or other data to report or as a student lesson on using Excel.
Grades:
4th - 12th, Higher Education, Adult Education, Staff
Types:
Showing 1-6 of 6 results


