3 results
7th grade graphing graphic organizers for Microsoft Excel

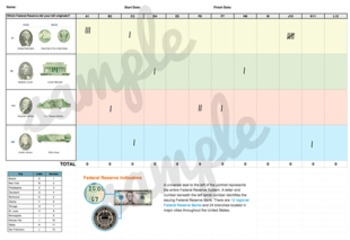
Which Federal Reserve Did My Bill Come From?
A tally sheet that is a great pre-cursor to any field trip or discussion on the Federal Reserve. Kiddos can learn how to identify which reserve the bill in thier wallet/purse comes from and over a period of time (determined by you), can tally where the bills are from that they and their parents use for transactions. Great project for students learning about money or economics!Comes as an Excel document, but you can export that into a PDF to print for your student where they can complete with a
Subjects:
Grades:
K - 12th

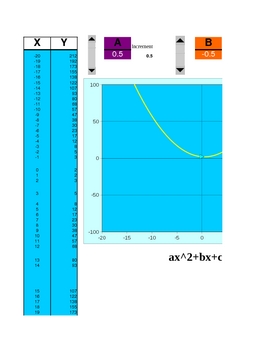
Functionator 5000 A graphing calculator/equation editor decay & growth
I built this Excel document to show what happens to lines and tables when you change variables and constants within an equations. There are three sheets:
y = mx+b
ax^2 + bx +c =0
c = p(1-r)^t
For instance, on the linear equation sheet, you can change m & b separately to see changes in the table and the graph. You can trace all equations. Much fun can be had.
Subjects:
Grades:
5th - 12th, Higher Education, Adult Education
Types:

Function Input/Output Table
Use this form to help students organize information when teaching how to graph an equation or function. Pair this with a coordinate plane pdf from leading math worksheet sites for a simple worksheet on graphing.
I use this method before teaching slope/intercept form so the students see the connection themselves.
In excel so its easily editable for your preference.
Grades:
7th - 10th
Showing 1-3 of 3 results


