11 results
7th grade graphing worksheets for Microsoft Excel
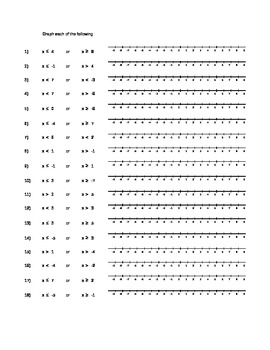
Compound Inequality Graphing Practice
This excel spreadsheet includes a sheet of practice for both AND and OR compound inequalities. There are also three sheets of blank number lines, so that a teacher could write their own inequalities for students to graph.
Grades:
5th - 9th
Types:
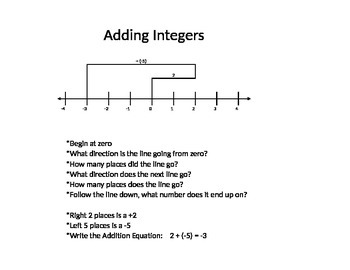
Adding Integers - Model on a Number Line
This activity provides 3 examples for the teacher to go through with the class, along with 3 extra examples for students to try individually and/or with a partner. It also includes 20 practice problems to ensure each student can not only solve an adding integers problem correctly, but they can also model it on a number line.
This file is saved in Excel, so when you print make sure you select print entire workbook. Also, since it is in Excel, feel free to change the problems as you see fit!
Subjects:
Grades:
5th - 7th
Types:

Graph Daily High and Low Temperatures - with handout
Per a few requests, I have added temperature lows as well as the temperature highs.
Type in the daily temperature on your computer with your students and it will automatically graph it for you as you type. You can pre-print the monthly graph for everyone in your class and they can follow along and graph with you. I use it with calendar math or other daily activities.
Great for explaining the scales of a graph and practicing accuracy in graphing and using rulers to connect lines. Look for tre
Subjects:
Grades:
4th - 7th
Types:
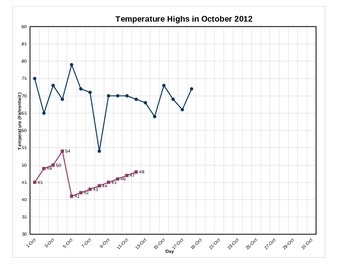
Graph Daily High and Low Temperatures - with handout
Per a few requests, I have added the capability to graph the low temperatures as well as the high temperatures.
Type in the daily temperature on your computer with your students and it will automatically graph it for you as you type. You can pre-print the monthly graph for everyone in your class and they can follow along and graph with you. I use it with calendar math or other daily activities.
Great for explaining the scales of a graph and practicing accuracy in graphing and using rulers t
Subjects:
Grades:
4th - 7th
Types:
Worksheets : Graphing Standard Form
Why limit yourself to just one worksheet. When downloaded, open the document, select "Yes", then allow Macros if prompted. If Macros are enabled, you can generate unlimited worksheets with different exercises simply by pressing Shift F9. Students need additional practice? Want all students to have different worksheets? Whatever the case may be, you can generate an unlimited number of worksheets by clicking the "New Worksheet" button. Simply Click Print and have a new worksheet, ready to go!
Grades:
7th - 12th
Types:
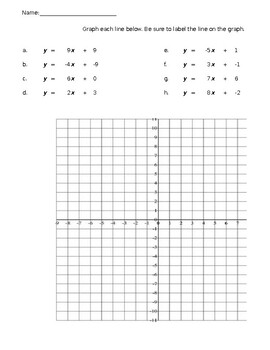
Worksheet: Graphing Slope-Intercept Form(Basic)
Why limit yourself to just one worksheet. When downloaded, open the document, select "Yes", then allow Macros. If Macros are enabled, you can generate unlimited worksheets with different exercises. Students need additional practice? Want all students to have different worksheets? Whatever the case may be, you can generate an unlimited number of worksheets by clicking the "New Worksheet" button. Simply Click Print and have a new worksheet, ready to go!
Grades:
6th - 12th
Types:
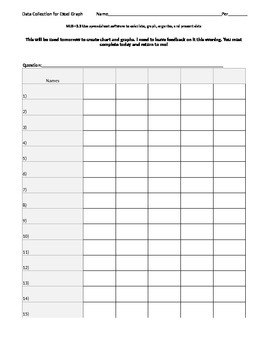
Day 1- Data Collection, Survey and Graphing (Survey Data Collection Sheet)
On day 1, students use this sheet to go around and survey others.
Grades:
4th - 9th
Types:

Function Input/Output Table
Use this form to help students organize information when teaching how to graph an equation or function. Pair this with a coordinate plane pdf from leading math worksheet sites for a simple worksheet on graphing.
I use this method before teaching slope/intercept form so the students see the connection themselves.
In excel so its easily editable for your preference.
Grades:
7th - 10th

Pictograph Fun For All Ages
This is an excel document for busy teachers whom are trying to teach students to read picture graphs. The teacher will be able to edit the document as pleased. Two sheets are created and the format is very easy to use. It can also be used with the smart board in the classroom.
Grades:
PreK - 12th
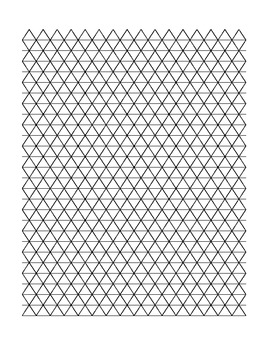
Excel Graph Paper Miscellaneous
This excel file includes graph paper other than coordinate grids. Number lines, 3 space graphing, 100 boards (good for percentage shading) and coordinate graphing with x-y tables are included in this spreadsheet.
Grades:
5th - 12th
Types:
Speed Lab Baseball and Softball with MPH conversion Graphs
Take the data from the Speed Lab Baseball and Softball and "Graph it"
Bar Graphing
Subjects:
Grades:
6th - 11th
Types:
Showing 1-11 of 11 results


