7 results
7th grade statistics projects for Easel Activities
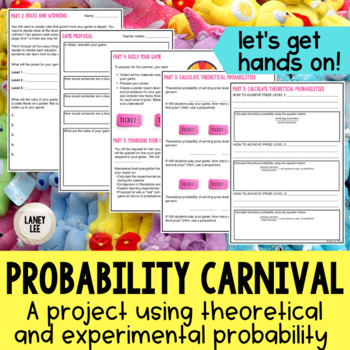
Probability Carnival Game Project - PDF & Digital
Looking for a fun, hands on way to bring probability to life? Are you ready to move past the "sit and get" style of whole group instruction? If you answered yes to either of those questions, then this resource is for you!Keep your students engaged and accountable with the interactive, versatile Probability Carnival! The steps of this project are designed to be rigorous and require students to predict, reflect, connect, and think critically about the situations being investigated.Using this proje
Subjects:
Grades:
6th - 8th
Types:
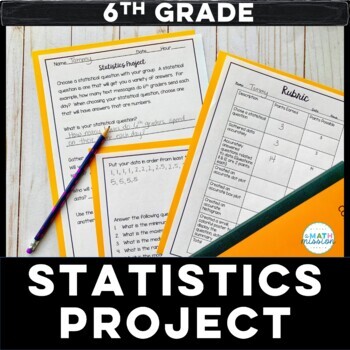
Math Statistics Project Based Learning Dot Plot Box Plot Histogram
Set your students loose to practice their statistics skills! This project is great for a culminating assessment. This project is centered around students coming up with a statistical question, and gathering data on that question. Students answer statistical questions, and create a dot plot, box and whisker plot and histogram based on the data collected. A summary of their findings is then created to display for others to see. A rubric is included for grading purposes. This project actively
Subjects:
Grades:
5th - 7th
Types:
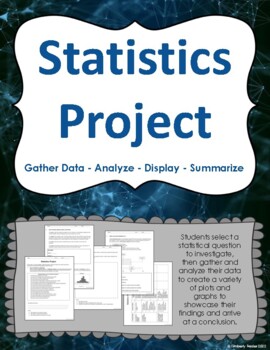
Statistics Project Data Display Poster Project / Box Plot / Histogram / Dot Plot
Dive into statistics and data displays with your students! Students come up with a statistical question, gather and analyze data to create a series of data displays to create a poster.Students work through their poster project to complete the following activities:1. Choose a statistical question2. Gather data3. Create a dot plot or stem-and-leaf plot4. Calculate the mean, median, mode and range5. Create a bar graph or histogram6. Create a box-and-whisker plot7. Summarize and conclude findings8.
Subjects:
Grades:
5th - 8th
Types:

Get Science Fair Ready! Project Based Learning Data Literacy for Middles School
Science fair project that helps you teach data management, statistics and probability. Real data and meaningful science! The data literacy and research project covers everything middle school students need to know about collecting and interpreting data for their own animal observation observation project. Great for science fairs! Learn about collecting objective, non-bias data and how to recognize it in the real world. → Everything is included to have students learn about data, collect data and
Subjects:
Grades:
6th - 8th
NGSS:
MS-LS2-1
Also included in: Canadian Grade 6 Math Bundle | For Print and Easel
Math Project Scatter Plots: Are You Really Going to Eat That? *DISTANCE LEARNING
PRINT and DIGITAL * * Makes distance planning so much easier!Math Project Scatter Plots: Are You Really Going to Eat That? This math project is a fun way for your students to use bivariate data that is highly engaging and relevant to them to construct scatter plots in a real-world situation! Your students will enjoy making choices about restaurants and meals they like to eat based on their personal needs and wishes. Students will organize the nutrition data of the meals they choose using tables
Subjects:
Grades:
7th - 10th, Adult Education
CCSS:
Statistics Project
7 page introductory (or review) lesson on collecting, organizing and interpreting statistical data. Students write their own statistical questions, review concepts and show their skills! This packet includes a teacher outline, observations page, assessment and opportunities for students to create a histogram, frequency chart, box plot and more!
Clarification: 7 student pages, along with 1 teacher outline page.
Subjects:
Grades:
5th - 8th
Types:
Weather Project
Students will need to find use statistics to find data on high and low temperatures of a specific city. They will then create some sort of visual representation of their data on a poster, PowerPoint, etc. They will also need to use the data in order to create a box-and-whisker plot of their data.
Subjects:
Grades:
5th - 9th
Types:
Showing 1-7 of 7 results


