688 results
Statistics worksheets for Microsoft Word
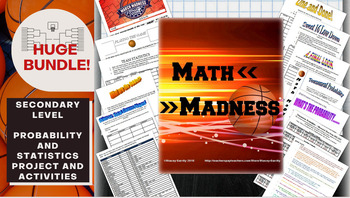
Math March Madness Full Tournament Project {BUNDLE}
Harness the excitement of NCAA March Madness with this huge project for secondary math teachers that follows all stages of the tournament! This Common Core aligned bundle comes with bonus parts not sold individually in my store so you can create a rich immersion in the tournament, practice probability and statistics and learn some interesting new ones along the way! Save $3 plus get bonus content by bundling!You can pick and choose which parts you would like to incorporate, or follow my schedu
Subjects:
Grades:
6th - 12th, Higher Education
Types:
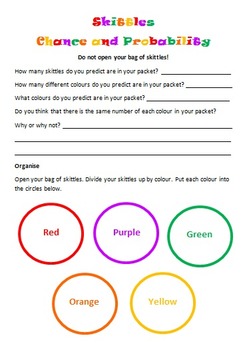
Skittles Chance and Probability (Editable)
Chance and Probability activity using yummy Skittles!!!
Students are to predict the colours and quantities before they open the skittles bag. Students are to complete a chance experiment where they use a tally to collect their data. Students then transfer their data in fractions, decimals and percentages. Students are to create a bar graph using their data as well as answer chance and probability questions about the data. I used this with my grade 5/6 students and they loved it!
Subjects:
Grades:
3rd - 10th
Types:
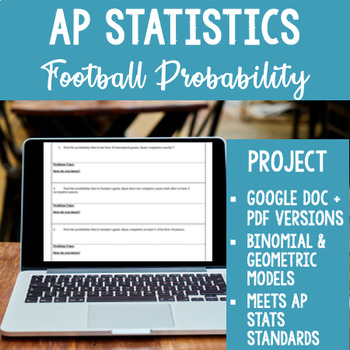
AP Statistics Football Binomial + Geometric Probability Project Digital + PDF
NEW for 2020! This resource now includes a fully editable Google Doc link for remote or distance learning! Assign the Google doc to your students, and they can type their answers directly into the boxes and submit their work digitally. This packet includes the following: Seven probability questions that use football quarterback pass completion rate, and require the use of the following probability techniques to answer: · Geometric PDF · Geometric CDF · Complement of Geometric CDF ·
Subjects:
Grades:
10th - 12th
Types:
Also included in: AP Statistics Project Bundle! 6 Projects + digital versions
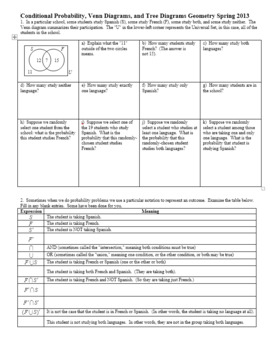
Conditional Probability and Tree Diagrams Geometry Spring 2013 w/ Key (Editable)
Once I've covered basic probability and statistical measures, I like to have students work with conditional probability, which can often go hand-in-hand with tree diagrams. I created this worksheet for my Geometry students, and I find that it is challenging for them, but it can be broken down into "baby steps" and they learn to navigate their way around a tree diagram to calculate conditional probabilities.
I use this activity within cooperative groups, and I circulate to make sure they are ge
Subjects:
Grades:
7th - 12th
Types:

Safe Cracker - Mean, Median, Mode, & Outliers - Math Fun!
Do your students get excited when you tell them it's time to study outliers and measures of center? Of course they don't.
But they will if you use this fun, Safe Cracker worksheet!
Students can become world famous safe crackers! Your students will use the clues and their math skills to help crack the safes, in order to claim the prizes found inside.
Students are given three "clues", which involve outliers and measures of center (mean, median, and mode). The answers become the numbers in the
Subjects:
Grades:
5th - 8th
Types:
CCSS:
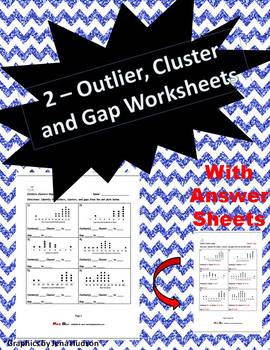
Outliers Clusters Gaps Worksheets (Two Worksheets)
Included are 2 worksheets in which students look at dot plots and line plots in order to find outliers, clusters and gaps. Also included are teacher answer sheets.
**This activity is included in a larger bundle (see link below)
https://www.teacherspayteachers.com/Product/Statistics-Unit-3505315
Subjects:
Grades:
5th - 7th
Types:
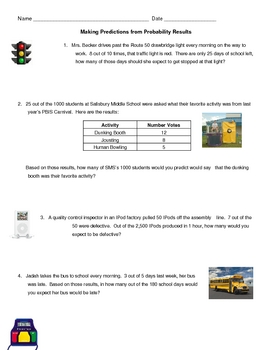
Probability ~ Making Predictions
On this two page worksheet plus answer key, students are asked to use the results of either a survey or experiment to make predictions. Students could use percents or proportions in order to solve these real world problems. Please see demo for types of problems.
Subjects:
Grades:
6th - 8th
Types:
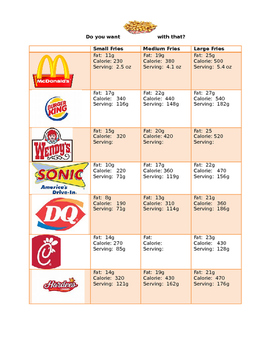
French Fry Scatter Plot & Best Line of Fit
Students will compare the nutritional values and serving sizes of french fries from various fast food restaurants. Based on this information, they will create scatter plots, best lines of fit and the equation of the trend line. Using the equation, they will estimate the unknown values of kid meals and supersized portions of french fries.
Subjects:
Grades:
8th - 11th
Types:
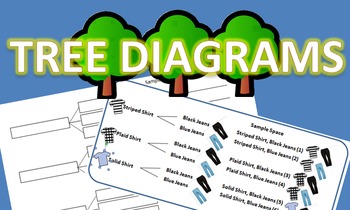
Tree Diagrams Notes and Practice Packet
I created this packet on tree diagrams for my probability unit so that students could work with one another to learn how to create a tree diagram on their own without my direct instruction. This gave me the freedom to help students that needed more individualized instruction and guidance. This packet was great to use before introducing the fundamental counting principle.
Subjects:
Grades:
4th - 9th
Types:
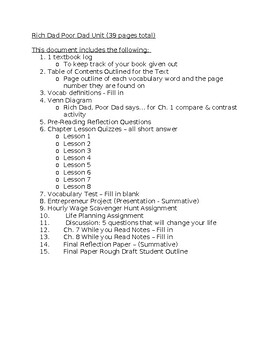
Rich Dad Poor Dad - ENTIRE UNIT (39 PAGES)!!!!!
The following is an ENTIRE UNIT for the book Rich Dad Poor Dad. It is a WORD DOC so you can edit it to your liking!This ENTIRE UNIT includes the following:1. 1 textbook log o To keep track of your book given out2. Table of Contents Outlined for the Texto Page outline of each vocabulary word and the page number they are found on3. Vocab definitions - Fill in4. Venn Diagram o Rich Dad, Poor Dad says… for Ch. 1 compare & contrast activity5. Pre-Reading Reflection Questions6. Chapter Lesson Quiz
Subjects:
Grades:
9th - 12th, Higher Education
Types:
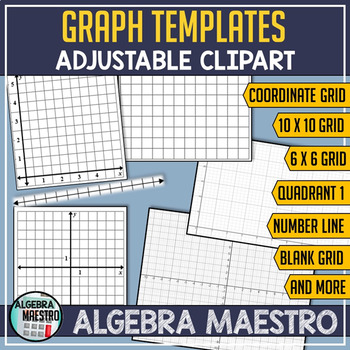
Adjustable Graph Templates
With Adjustable Graph Templates you'll receive a variety of graphs that are formatted to be easily adjustable, this is to help you create your own assignments. The full-page templates can be used as cut-outs, very useful for Foldables, and Interactive Notebooks. There are a variety of graph templates: coordinate axis (axes), 1st quadrant, number line, grid - and with a variety of units and sizes to suit your needs. To adjust a graph - click the desired graph and adjust the size by selecting-
Subjects:
Grades:
Not Grade Specific
Types:
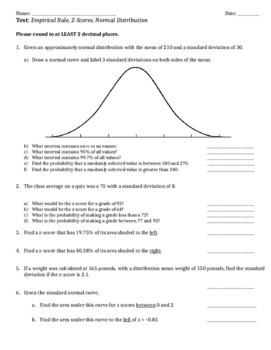
Emprical Rule, Z-Scores, Normal Distribution Assessment/Review
This product can be used as a review or assessment for the empirical rule, z-scores and standard deviation, and the normal distribution. This is meant for a regular Statistics class, not AP. Can also be used for the Algebra II unit on Statistics.
Subjects:
Grades:
10th - 12th
Types:
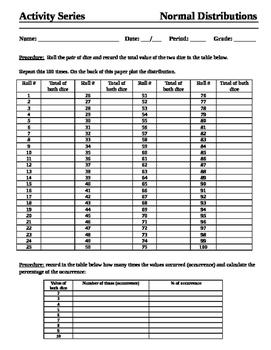
Normal Distributions - Activity Series
This activity sheet helps students better understand normal distributions through the use of dice. Each student rolls a pair of dice and adds the total of each dice and records it 100 times. Then they plot the distribution and in most cases it comes out a bell curve. Its a fun and easy way to show the distribution. You could pair students up for less dice usage.
Subjects:
Grades:
10th - 12th
Types:
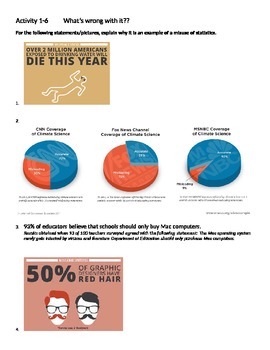
1-6 Misleading Statistics Worksheet
Students are asked to give a reason why each statistic is misleading. This accompanies Bluman's Elementary Statistic Book, section 1-6.
The worksheet has two pages, and answers are attached.
**There is a PowerPoint to accompany the worksheet for class discussion.
Subjects:
Grades:
9th - 12th
Types:
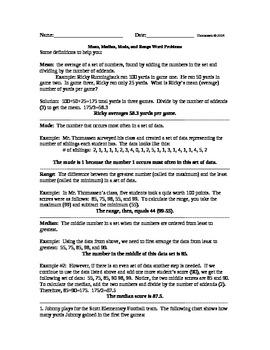
Mean Median Mode and Range Word Problems FREE
These free mean, median, mode, and range word problems (10 problems in a total of 20 pages with the definition overview and answer key) combine silly names and teacher-created data for the students to work with. Also, the beginning provides a quick definition overview of how to solve mean, median, mode, and range. This organizer provides a great amount of space for students to show their work. Don’t forget to peruse my other resources for Mean, Median, Mode, and Range. Thank you!
Subjects:
Grades:
5th
Types:
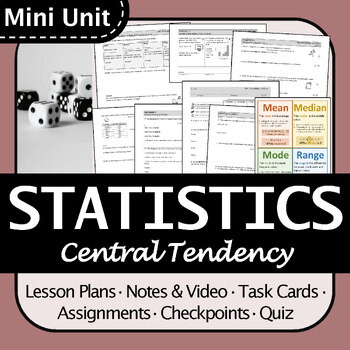
BC Math 8 Measures of Central Tendency Mini Unit, Engaging, Differentiated
This is an engaging mini unit that would work great for an in-depth look at measures of central tendency (mean, median, mode, and range) and how to choose them. The resources are well-organized and differentiated so they are accessible to a wide range of students.Students learn:How to calculate mean, median, mode, and range from a data set or frequency table.How to choose the best measure of central tendency (mean, median, or mode) given a particular situation or data set. Includes:Detailed les
Subjects:
Grades:
6th - 9th
Types:
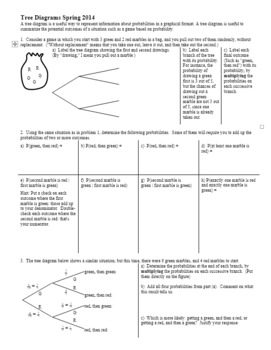
Tree Diagrams Spring 2014 with Answer Key (Editable)
This worksheet is designed to replace a lecture on tree diagrams.
I start out class with a 15-minute "mini-lesson," giving my students some basic examples of what today's lesson will be about. Once the mini-lesson is over, I have them get to work within their groups on this worksheet.
I use this activity within cooperative groups, and I circulate to make sure they are getting the purpose of the questions.
The file includes spiral review problems.
This worksheet is intended to be written on
Subjects:
Grades:
8th - 12th
Types:
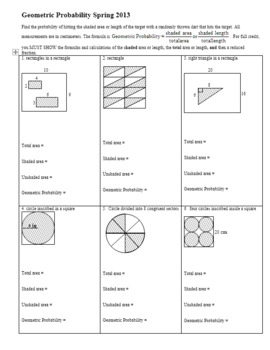
Geometric Probability Worksheet Spring 2013 with Answer Key (Editable)
I wrote this worksheet to replace a lecture on geometric probability. Instead of giving my students a lot of examples, I give them the basic formula for geometric probability, (included at the start of this worksheet) and the "helper formula," which often comes in handy:
shaded area + unshaded area = total area
With that information, I set them to work on this activity within cooperative groups, and I circulate to make sure they are getting the purpose of the questions. This generally gives
Subjects:
Grades:
7th - 12th
Types:
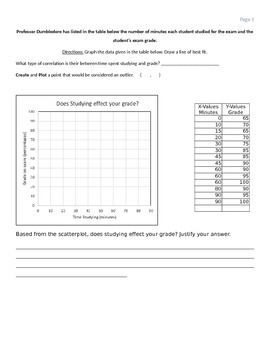
Scatter plot worksheet (Positive Correlation)
In this worksheet, the students are given a scenario and table of data points. The students must plot the points, draw a line of best fit, create & plot a possible outlier data point. Also, there is a short writing portion where students must reflect and write about the scatter plot scenario.
Subjects:
Grades:
6th - 9th
Types:
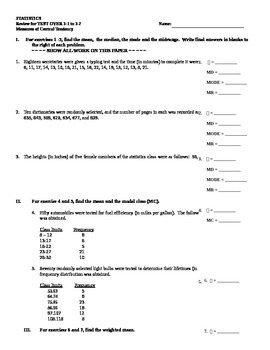
Measures of Central Tendency Review Mean, Median, Mode & Midrange
This worksheet reviews sections 3-1 and 3-2 of Bluman's Elementary Statistics textbook. Students are asked to calculate Mean, Median, Mode and Midrange for sets of data. They are also asked to find the mean and modal class for grouped frequency distributions, and weighted means. There is one question regarding the distribution of data.
Subjects:
Grades:
10th - 12th, Higher Education
Types:
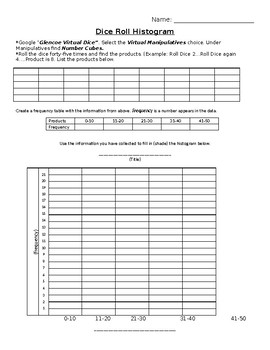
Dice Roll Histogram - Online Interactive Activity Frequency Table & Historgram
Students will complete a frequency table and histogram that corresponds to data collected through the use of rolling two dice (Statistics Lesson). To get the data for this frequency table, students will roll two dice and multiple the numbers rolled together. The product of these two rolls will be the data point. Students will write down each product, rolling their dice a total of 45 times. Students will then fill in the frequency table and graph on a histogram. We used an online dice. This helps
Subjects:
Grades:
5th - 8th
Types:
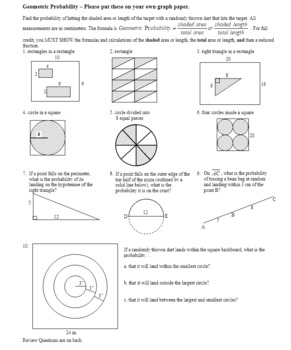
Geometric Probability Worksheet Spring 2012 with Answer Key (Editable)
I wrote this worksheet to replace a lecture on geometric probability. Instead of giving my students a lot of examples, I give them the basic formula for geometric probability, (included at the start of this worksheet) and the "helper formula," which often comes in handy:
shaded area + unshaded area = total area
With that information, I set them to work on this activity within cooperative groups, and I circulate to make sure they are getting the purpose of the questions. This generally gives
Subjects:
Grades:
7th - 12th
Types:
AP Statistics - Unit 8 & 9: Inference for Linear Regression and Chi Square
**All questions in this document are NEW and solutions cannot be googled**(as of this post on 5/30/23)Test-prep practice directly aligned to College Board's CED for AP Statistics. This packet contains 10 multiple choice questions and 2 free response questions, in addition to an answer key. The content presented in this test-prep packet covers inference procedures for slope (both hypothesis testing and confidence interval) as well as all three types of chi square tests. The download is an edit
Subjects:
Grades:
9th - 12th
Types:
CCSS:
Permutations and Factorial Notation Worksheet (17 Questions)
Permutations and Factorial Notation Worksheet17 Questions with the solutions1 page for the questions1 page for the answers* AlSO AVAILABLE FOR YOU OR A COLLEAGUE! - CLICK ANY LINK YOU WANT:Probability & OddsMean, median, mode, range, line plot, and Box and whisker WorksheetStatistical Math (GED REVIEW)The Binomial Theorem Worksheet (10Q)Theoretical Probability WorksheetProbability Word Problems (Worksheet) You may also be interested in my other top-selling products: EQUIVALENT FRACTIONS (33
Subjects:
Grades:
9th - 12th, Higher Education, Adult Education, Staff
Types:
Showing 1-24 of 688 results


