275 results
7th grade statistics worksheets for Microsoft Word
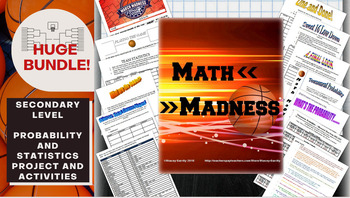
Math March Madness Full Tournament Project {BUNDLE}
Harness the excitement of NCAA March Madness with this huge project for secondary math teachers that follows all stages of the tournament! This Common Core aligned bundle comes with bonus parts not sold individually in my store so you can create a rich immersion in the tournament, practice probability and statistics and learn some interesting new ones along the way! Save $3 plus get bonus content by bundling!You can pick and choose which parts you would like to incorporate, or follow my schedu
Subjects:
Grades:
6th - 12th, Higher Education
Types:
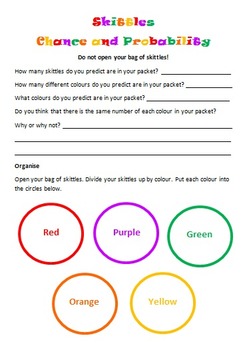
Skittles Chance and Probability (Editable)
Chance and Probability activity using yummy Skittles!!!
Students are to predict the colours and quantities before they open the skittles bag. Students are to complete a chance experiment where they use a tally to collect their data. Students then transfer their data in fractions, decimals and percentages. Students are to create a bar graph using their data as well as answer chance and probability questions about the data. I used this with my grade 5/6 students and they loved it!
Subjects:
Grades:
3rd - 10th
Types:
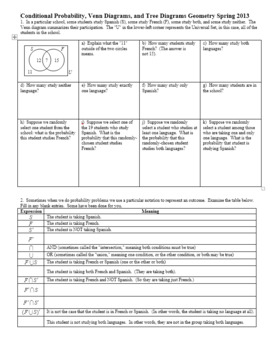
Conditional Probability and Tree Diagrams Geometry Spring 2013 w/ Key (Editable)
Once I've covered basic probability and statistical measures, I like to have students work with conditional probability, which can often go hand-in-hand with tree diagrams. I created this worksheet for my Geometry students, and I find that it is challenging for them, but it can be broken down into "baby steps" and they learn to navigate their way around a tree diagram to calculate conditional probabilities.
I use this activity within cooperative groups, and I circulate to make sure they are ge
Subjects:
Grades:
7th - 12th
Types:

Safe Cracker - Mean, Median, Mode, & Outliers - Math Fun!
Do your students get excited when you tell them it's time to study outliers and measures of center? Of course they don't.
But they will if you use this fun, Safe Cracker worksheet!
Students can become world famous safe crackers! Your students will use the clues and their math skills to help crack the safes, in order to claim the prizes found inside.
Students are given three "clues", which involve outliers and measures of center (mean, median, and mode). The answers become the numbers in the
Subjects:
Grades:
5th - 8th
Types:
CCSS:
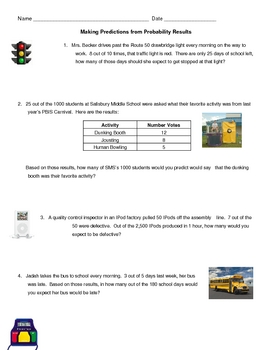
Probability ~ Making Predictions
On this two page worksheet plus answer key, students are asked to use the results of either a survey or experiment to make predictions. Students could use percents or proportions in order to solve these real world problems. Please see demo for types of problems.
Subjects:
Grades:
6th - 8th
Types:
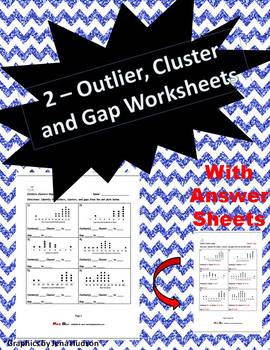
Outliers Clusters Gaps Worksheets (Two Worksheets)
Included are 2 worksheets in which students look at dot plots and line plots in order to find outliers, clusters and gaps. Also included are teacher answer sheets.
**This activity is included in a larger bundle (see link below)
https://www.teacherspayteachers.com/Product/Statistics-Unit-3505315
Subjects:
Grades:
5th - 7th
Types:
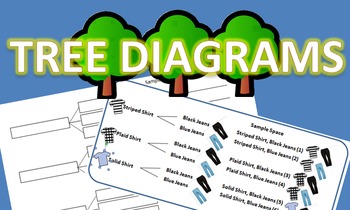
Tree Diagrams Notes and Practice Packet
I created this packet on tree diagrams for my probability unit so that students could work with one another to learn how to create a tree diagram on their own without my direct instruction. This gave me the freedom to help students that needed more individualized instruction and guidance. This packet was great to use before introducing the fundamental counting principle.
Subjects:
Grades:
4th - 9th
Types:
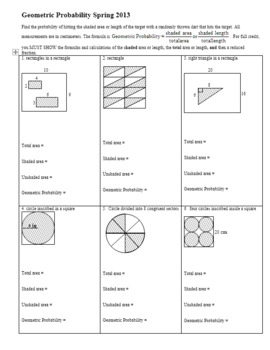
Geometric Probability Worksheet Spring 2013 with Answer Key (Editable)
I wrote this worksheet to replace a lecture on geometric probability. Instead of giving my students a lot of examples, I give them the basic formula for geometric probability, (included at the start of this worksheet) and the "helper formula," which often comes in handy:
shaded area + unshaded area = total area
With that information, I set them to work on this activity within cooperative groups, and I circulate to make sure they are getting the purpose of the questions. This generally gives
Subjects:
Grades:
7th - 12th
Types:
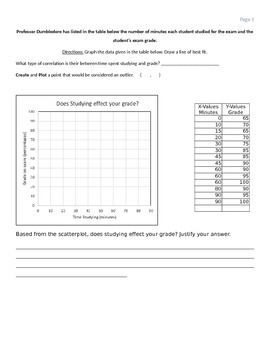
Scatter plot worksheet (Positive Correlation)
In this worksheet, the students are given a scenario and table of data points. The students must plot the points, draw a line of best fit, create & plot a possible outlier data point. Also, there is a short writing portion where students must reflect and write about the scatter plot scenario.
Subjects:
Grades:
6th - 9th
Types:
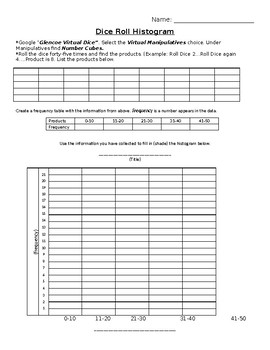
Dice Roll Histogram - Online Interactive Activity Frequency Table & Historgram
Students will complete a frequency table and histogram that corresponds to data collected through the use of rolling two dice (Statistics Lesson). To get the data for this frequency table, students will roll two dice and multiple the numbers rolled together. The product of these two rolls will be the data point. Students will write down each product, rolling their dice a total of 45 times. Students will then fill in the frequency table and graph on a histogram. We used an online dice. This helps
Subjects:
Grades:
5th - 8th
Types:
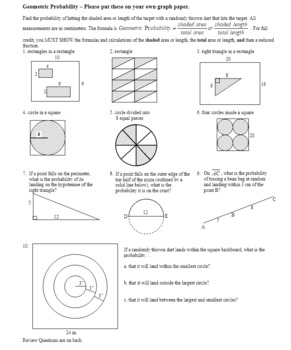
Geometric Probability Worksheet Spring 2012 with Answer Key (Editable)
I wrote this worksheet to replace a lecture on geometric probability. Instead of giving my students a lot of examples, I give them the basic formula for geometric probability, (included at the start of this worksheet) and the "helper formula," which often comes in handy:
shaded area + unshaded area = total area
With that information, I set them to work on this activity within cooperative groups, and I circulate to make sure they are getting the purpose of the questions. This generally gives
Subjects:
Grades:
7th - 12th
Types:
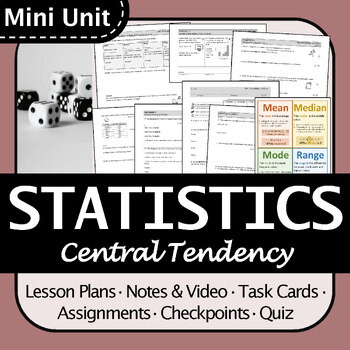
BC Math 8 Measures of Central Tendency Mini Unit, Engaging, Differentiated
This is an engaging mini unit that would work great for an in-depth look at measures of central tendency (mean, median, mode, and range) and how to choose them. The resources are well-organized and differentiated so they are accessible to a wide range of students.Students learn:How to calculate mean, median, mode, and range from a data set or frequency table.How to choose the best measure of central tendency (mean, median, or mode) given a particular situation or data set. Includes:Detailed les
Subjects:
Grades:
6th - 9th
Types:
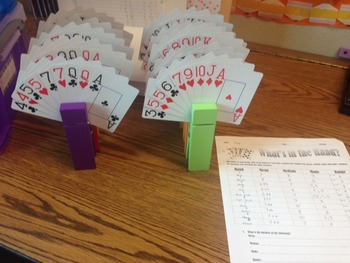
Statistics Mode, Median, Mean, Range Worksheet for Math or Psychology
What's in the Hand: Activity makes learning mode, median, mean, and range fun. You will need two packs of playing cards in order to use 10 different variations. I use giant clothes pins to hold a total of 9 cards for each station. Each student gets a worksheet and is assigned to a group of 4-5 students. Students will complete the first rotation by figuring the mean, median, mode, and range, and then rotate to each other station in about 5 min intervals. At the end they will answer the questions
Subjects:
Grades:
5th - 12th
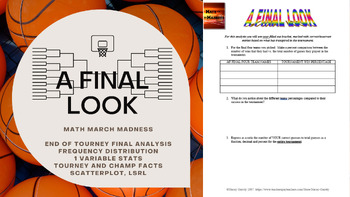
Math March Madness - A Final Look (Freq Distributions, Stats, Regression Lines)
Fill out a bracket, watch the tournament unfold and then mathematically analyze how you did! This activity is flexible enough to be used for a variety of levels. I have used all 6 pages for an AP Statistics class, and have used pages 1 through 5 for an Algebra or Algebra 2 class. You could even use it in lower levels as long as you are covering percents, and basic stats like mean, median, mode and graphing. The document is editable so you can adjust/delete to tailor to the level of statistic
Subjects:
Grades:
4th - 12th, Higher Education
Types:
Common Core – 6th grade – Data & Statistics Review Booklet
This 8-page review booklet was designed to provide students a detailed review of the standards under the Data and Statistics strand of the 6th Grade Common Core Standards. This resource includes notes and practice questions for the topics including: types of distribution, measures of center, measures of spread, mean absolute deviation (MAD), line plots, histograms, and box-and-whisker plots.
At the end of the review booklet, there are 20 multiple choice test style questions. It is a great way f
Subjects:
Grades:
5th - 8th
Types:
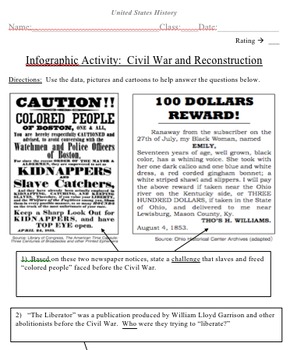
U.S. History Infographic Activity
Looking for something to help teach students how to comprehend and analyze graphs, timelines, political cartoons, posters, art and much more from U.S history? It's all here!
The content focus is on United States history and includes topics like the Civil War, Reconstruction, Women's Issues, The Roaring '20s, the Great Depression and the New Deal, the Progressive Era and the Great Society. It's all on one document, but you could easily print them off as separate, stand alone activities if yo
Subjects:
Grades:
6th - 12th, Adult Education
Types:

Math 8 Unit 19 Fractions, Percents, and Statistics
These editable lessons and PDF worksheets were written by Alex Benn using the concepts described in his book Tenacious-Teaching: Uniting Our Superpowers to Save Our Classrooms and on his website: Tenacious-Teaching.com. They include an introductory warm-up designed to remediate the required prerequisite knowledge; concise notes; tasks that require escalating effort; numerous examples to prevent misconceptions; and in-class practice problems to promote mastery. The homework problems are ordered f
Subjects:
Grades:
7th - 9th
Types:
Mini Unit: Percents & Percent of a Number | Fun, Engaging, Differentiated!
This is an engaging mini unit that would work great for an in-depth look at representing percents and percent of a number. The resources are well-organized and differentiated so they are accessible to a wide range of students.Students learn:Representing percents (visually, decimals, fractions)Percent of a number in multiple ways (mental math, multiplying)Includes:Detailed lesson plans 2 number talks2 sets of comprehensive and visual scaffolded notes (with lesson video).2 Sets of task cards for
Subjects:
Grades:
6th - 9th
Types:
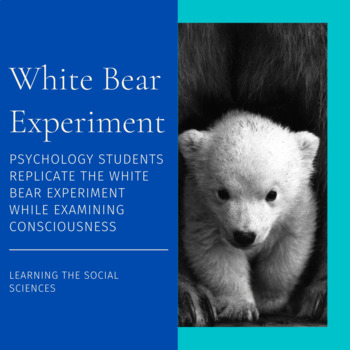
White Bear Experiment: Students Conduct a Consciousness Experiment
My students like this quick and easy experiment. They replicate the famous "White Bear Experiment" on classmates or with others who volunteer for the study. They then chart their results. There is then a reading discussing people controlling their consciousness with a spot for students to reflect on the information.I use this for my psychology course when we discuss consciousness. There is no key for this as answers will vary depending on the results of their experiment.This experiment can s
Grades:
7th - 12th
Types:
Also included in: Psychology Curriculum Custom Bundle
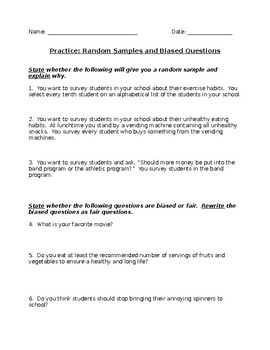
Random Samples and Biased Questions
This is a great formative assessment in a statistics unit for a lesson on random samples and bias in surveys. It could be a classwork assignment, exit ticket, or homework worksheet!
Worksheet and Answer Key included!
Subjects:
Grades:
5th - 8th
Types:
The Normal Curve Reading Worksheet **Editable**
Reading Passage focused on the concept of the normal curve in Highschool Psychology. See Thumbnails for more details. Simply purchase, download and copy!10x questions based on the readingGreat for sub plans!Unlike other teacher's resources, this is totally editable!Be sure to check out these other products!General Science:Scientific Method Reading WorksheetHistory of Measurement Systems Reading WorksheetExperimental Variables Reading WorksheetEarth Science:Intro to Earth Science Reading Workshee
Subjects:
Grades:
7th - 12th
Types:
Also included in: Statistical Evaluations Lesson Reading Worksheet Bundle **Editable**
Descriptive Statistics Reading Worksheet **Editable**
Reading Passage focused on the concept of descriptive statistics in Highschool Psychology. See Thumbnails for more details. Simply purchase, download and copy!10x questions based on the readingGreat for sub plans!Unlike other teacher's resources, this is totally editable!Be sure to check out these other products!General Science:Scientific Method Reading WorksheetHistory of Measurement Systems Reading WorksheetExperimental Variables Reading WorksheetEarth Science:Intro to Earth Science Reading Wo
Subjects:
Grades:
7th - 12th
Types:
Also included in: Statistical Evaluations Lesson Reading Worksheet Bundle **Editable**
Correlation vs Causation Reading Worksheet **Editable**
Reading Passage focused on the concept of correlation vs causation in Highschool Psychology. See Thumbnails for more details. Simply purchase, download and copy!10x questions based on the readingGreat for sub plans!Unlike other teacher's resources, this is totally editable!Be sure to check out these other products!General Science:Scientific Method Reading WorksheetHistory of Measurement Systems Reading WorksheetExperimental Variables Reading WorksheetEarth Science:Intro to Earth Science Reading
Subjects:
Grades:
7th - 12th
Types:
Also included in: Research in Psychology Lesson Reading Worksheet Bundle **Editable**
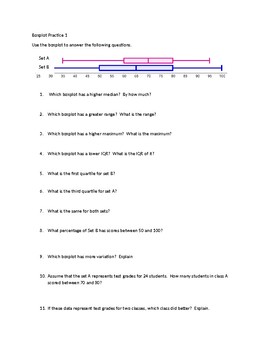
Boxplot Practice
This contains 5 boxplot worksheets analyzing, comparing and describing two boxplots. There are 3 easier ones and 2 that are more advanced. Students will have to identify and compare median, range, IQR, quartiles, minimum and maximum. They will interpret which has more variation and be able to interpret which set of scores is better. The worksheets are created in Word and the questions are fully editable. The first three can be used in middle school math or Algebra I. The 2 that are more ad
Subjects:
Grades:
6th - 12th
Types:
CCSS:
Showing 1-24 of 275 results


