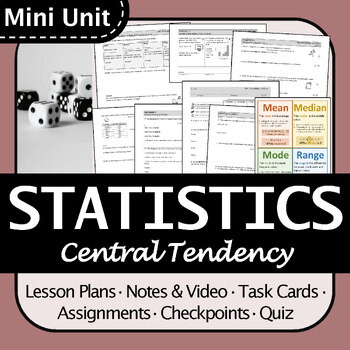
BC Math 8 Measures of Central Tendency Mini Unit, Engaging, Differentiated
- Zip
What educators are saying
Products in this Bundle (2)
Bonus
Description
This is an engaging mini unit that would work great for an in-depth look at measures of central tendency (mean, median, mode, and range) and how to choose them. The resources are well-organized and differentiated so they are accessible to a wide range of students.
Students learn:
- How to calculate mean, median, mode, and range from a data set or frequency table.
- How to choose the best measure of central tendency (mean, median, or mode) given a particular situation or data set.
Includes:
- Detailed lesson plans with warm-up suggestions
- 2 sets of comprehensive and visual scaffolded notes (with lesson video).
- 2 Sets of task cards for collaborative group work.
- 2 Individual worksheet assignments (differentiated into 3-levels)
- 2 Checkpoints with student self-assessment (can be used for review)
- 1 quiz with rubric and key
- 1 challenge assignment with extending questions (for early finishers)
- .docx and .pdf files included
- All resources are editable and come with a step-by-step key
This was originally created for the BC Math 8 redesigned curriculum in British Columbia Canada. However, all files are editable and it can be adapted to meet your students' needs.
Instructional Time:
There are lots of optional extensions included. These activities can take your class anywhere from 4 - 10 hours.
Links to other BC Math 8 resources:
- Entire B.C. Math 8 curriculum (9 units)
- Unit 1: Proportional Reasoning
- Unit 2: Fractions
- Unit 3: Algebra and Solving Linear Equations
- Unit 4: Linear Relations and Representing Patterns
- Unit 5: The Pythagorean Theorem
- Unit 6: Surface Area
- Unit 7: Volume
- Unit 8: Percents and Financial Literacy
- Unit 9: Probability and Data
- Spiral Review for the entire BC Math 8 course
- Resource Bundle for B.C. Math 8: notes, assignments, quizzes, review, test
Click here to become a follower and be the first to hear about my freebies, sales, and new products.
Did you know that you can earn 5% back for future purchases by leaving feedback? I would love to hear from you!
Please note that this resource is for use by one teacher only. Colleagues must purchase additional licenses. You may not upload this resource to the internet in any form unless it is password protected for your individual class.


