144 results
Statistics worksheets for Microsoft PowerPoint
Mean, Median, Mode, and Range (Bundled Unit) - Distance Learning
This is an enjoyable, interactive, and engaging bundled unit covering mean, median, mode, and range (and introduces outliers). This unit is great for 5th and 6th graders and 7th graders who struggle with these concepts.Included in this bundled unit:PowerPointAnimated and fun 4-part, 21-slide PowerPoint (multi-day use)-Part 1 – The Meaning of Mean-Part 2 – Getting in the Middle of Median-Part 3 – Making the Most of Mode-Part 4 – Home, Home on the RangeEach section offers plenty of practice probl
Subjects:
Grades:
5th - 7th
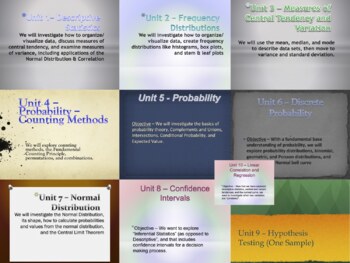
A Mountain of Statistics Curriculum - One Full Year Bundle
This is a bundle of 10 Units, Midterm Exam, & Final Exam designed for a high school Statistics Class (can be applied to University discipline). Each unit plan includes Common Core Standards, Key Concepts/Enduring Understandings, Essential Questions/Do Now, Activities, Resources, Procedures, and Assessment techniques. It is designed to be a lifelong tool that you can add to, edit, and re-use every year! Please see each Unit Statistics Product in the MountainWorks Store (sold separately) for
Subjects:
Grades:
9th - 12th, Higher Education
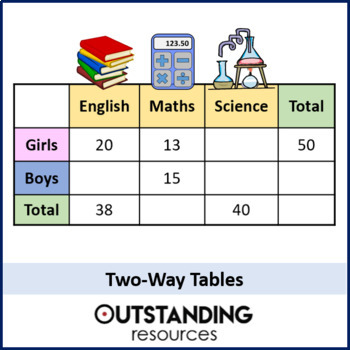
Two-Way Tables and Probability Lesson
This is a whole lesson looking at the different aspects of Two-Way Tables. This is a way of displaying data and questions are often more varied than some students may think. The lesson covers three main types of questions 1) Filling in missing data 2) Reading data from a two-way table 3) Taking figures out of a worded context and putting it into a two-way table in order to solve a probability. This lesson is ready to go, with no prep required. It is also great for home learning and flip learnin
Subjects:
Grades:
6th - 10th
Also included in: Statistics ALL LESSONS
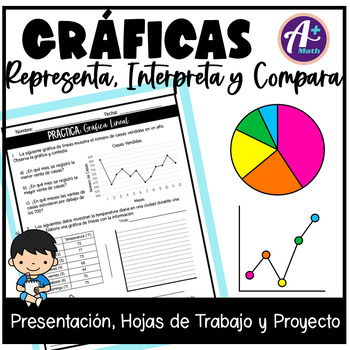
Gráficas - Estadística
Gráficas - Estadística - Analizar DatosEste recurso trabaja los siguientes temas:Gráficas: Representa, Interpreta y Compara•Recopilar y Organizar Datos •Tabla de Frecuencias•Gráfica de Barras•Gráfica Circular•Gráfica Pictórica•Gráfica Lineal•Tabla de Tallo y Hojas•Diagrama de PuntosEl recurso incluye:•Presentación en PowerPoint y PDF - 55 diapositivas con explicaciones y ejemplos•8 hojas de trabajo - Incluye la clave de respuestas•3 hojas de trabajo - Proyecto - Encuesta y analiza los res
Subjects:
Grades:
4th - 6th
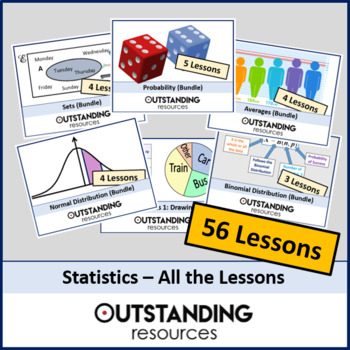
Statistics ALL LESSONS
This is 56 whole lessons with ALL additional resources included! Below is a list (alphabetical) of precisely what lessons are included. If you want more information then all individual lessons are available in my shop and maybe it might be worth buying one or two before purchasing this fantastic bundle. 1. Averages 1 - Mode, Median and Mean2. Averages 2 - comparing the different averages3. Averages 3 - Grouped Data (Estimated Mean) 4. Averages 4 - Mean vs Estimated Mean5. Bar Charts and Compara
Subjects:
Grades:
6th - 12th, Higher Education
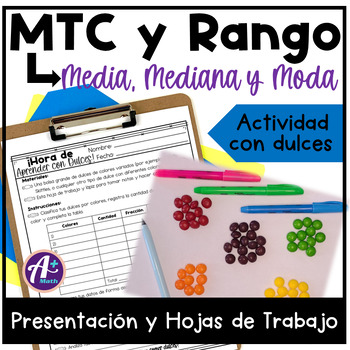
Medidas de Tendencia Central y Rango - media, mediana y moda
Medidas de Tendencia Central y Rango - Analizar DatosEste recurso trabaja los siguientes temas:MediaMedianaModaRangoAnalizar DatosEl recurso incluye:•Presentación en PowerPoint y PDF - 27 diapositivas con explicaciones y ejemplos•5 hojas de trabajo - Incluye la clave de respuestas•1 hojas de trabajo - Actividad con Dulces Cualquier duda, pregunta o sugerencia escríbeme en diana@aplusmathbydianaaviles.com.Recuerda dejar una reseña de este recurso y seguir mi tienda en este enlace: A Plus Math by
Subjects:
Grades:
5th - 8th
Statistics Unit 6 Bundle - Discrete Probability (12 days)
This is a unit plan bundle for a Statistics class. The plans include common core math standards, time frame, activities, enduring understandings, essential questions, and resources used. It is designed to last 12 days, depending on pacing. The plans include: 39-slide presentation, with annotated guide for reference3 Worksheets"Do Now" Entrance problems2 quizzesSpreadsheet Activity - Binomial, Geometric, Poisson DisributionsReview slides (for student-group communicators)Unit test (with review pac
Subjects:
Grades:
9th - 12th, Higher Education
CCSS:
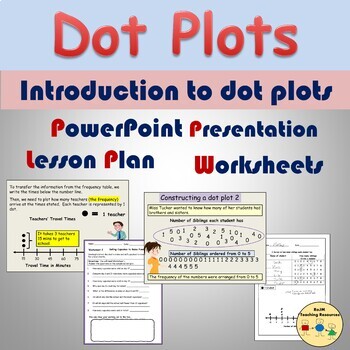
Dot Plots Line Plots Worksheets Presentation Frequency Tables Statistics
This resource relates to statistics on the topic of dot plots. It introduces dot plots on PowerPoint (12 Slides). The presentation demonstrates how the data was collected, rearranging data in numerical order, and presenting the data on a frequency table. Using the information on the frequency table, students are shown how to create a dot plot/line plot via Slide Show animation. Two detailed examples are shown. Content:· PowerPoint Presentation (12 Slides)· 1 Flexible Lesson Plan (1- 2 hrs)· 2 Se
Subjects:
Grades:
3rd - 5th
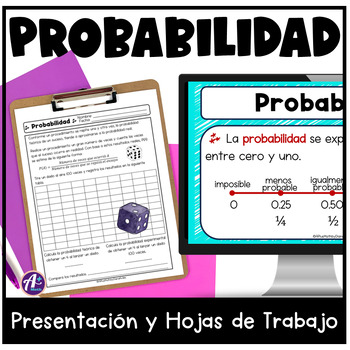
Probabilidad - Eventos Simples y Compuestos - Diagrama de Árbol
Probabilidad - Eventos Simples y Compuestos - Diagrama de ÁrbolEste recurso trabaja los siguientes temas:Eventos simplesProbabilidadResultados favorables Resultados posibles Espacio muestralEventos posibles, seguros o imposibles Hallar la probabilidad de eventos simplesEventos compuestos independientesRegla de multiplicaciónDiagrama de árbol y probabilidadEl recurso incluye:•Presentación en PowerPoint y PDF - 64 diapositivas con explicaciones y ejemplos•5 hojas de trabajo - Incluye la clave de r
Subjects:
Grades:
5th - 7th
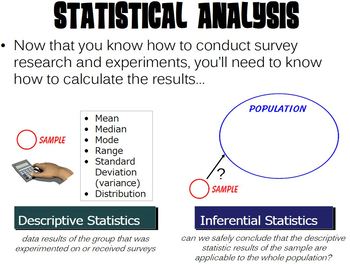
Statistical Analysis PowerPoint
Contains a PowerPoint presentation covering statistical analysis. This PP was designed to be used with a Psychology or AP Psychology course as part of a Research Methods unit, but it could also be used in a variety of math and/or statistic classes.The PowerPoint is HIGHLY animated and is designed to capture student attention. Each slide has transitions along with rich, moving media. Additionally, a guided note sheet (both an editable Microsoft Word version and a PDF version) is included in the z
Subjects:
Grades:
7th - 12th, Higher Education, Adult Education, Staff
The Fundamental Counting Principle, Permutations, and Combinations Review Game
This resource comes with a PowerPoint Slide Show game, handouts for students, and keys and printing instructions for teachers. It covers the topics mentioned in the title above. It is designed to be interactive, i.e. you can click on questions and it will navigate your presentation to the right page. Once you view the answer, you simply click at the bottom right to go back to the questions page. It also keeps track of the questions that have already been answered as long as you do not exit the s
Subjects:
Grades:
9th - 12th
CCSS:
Statistics Unit 4 Bundle - Probability Counting Methods Curriculum (10 days)
Statistics Unit 4 Bundle - Probability Counting Methods Curriculum (10 days)
This is a unit plan bundle for a Statistics class. The plans include common core math standards, time frame, activities, enduring understandings, essential questions, and resources used. It is designed to last two weeks. The plans include:
35-slide presentation, with annotated guide for reference
4 Worksheets
"Do Now" Entrance problems
2 quizzes
Graphing Calculator Activity/Walkthough
Review slides (for response syst
Subjects:
Grades:
9th - 12th, Higher Education
CCSS:
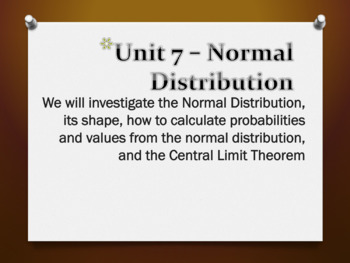
Statistics Unit 7 Bundle - Normal Distribution (12 days)
This is a unit plan bundle for a Statistics class. The plans include common core math standards, time frame, activities, enduring understandings, essential questions, and resources used. It is designed to last 12 days, depending on pacing. The plans include: 41-slide presentation, with annotated guide for reference4 Worksheets"Do Now" Entrance problems2 quizzesSpreadsheet Activity - Normal DistributionReview slides (for student-group communicators)Unit test (with review packet)Pacing Guide with
Subjects:
Grades:
9th - 12th
CCSS:
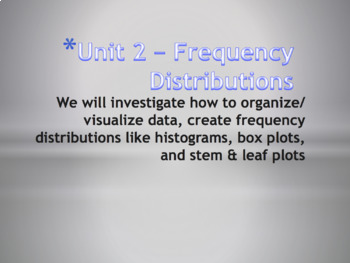
Statistics Unit 2 Bundle - Frequency Distributions Curriculum (6 days)
This is a unit plan bundle for a Statistics class. The plans include common core math standards, time frame, activities, enduring understandings, essential questions, and resources used. It is designed to last 6 days. The plans include: 21-slide presentation, with annotated guide for reference2 Worksheets"Do Now" Entrance problemsSpreadsheet Activity - "Spreadsheets and Heartbeats"Unit ReviewUnit TestGraphing Calculator instructions included on slidesPacing guide with administrative unit planAll
Subjects:
Grades:
9th - 12th, Higher Education
CCSS:
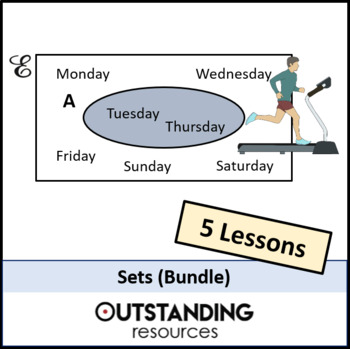
Venn Diagrams and Sets Bundle
This bundle contains 5 Lessons on Sets and Venn Diagrams. It includes the following lessons:Lesson 1 - Introduction to Sets and Venn DiagramsLesson 2 - Venn Diagram and Set Notation, plus 2 setsLesson 3 - Two and Three sets including drawing and shadingLesson 4 - Calculating Probability involving sets and Venn DiagramsLesson 5 - Conditional probability with Venn DiagramsALL lessons come with additional resources, such as worksheets with answers. This is an excellent bundle of resources!!ALSO:1.
Subjects:
Grades:
9th - 12th
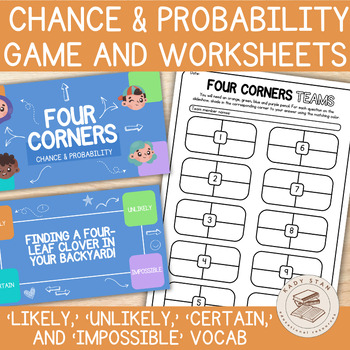
Chance and Probability Game | Slideshow Activity & Worksheets | 2nd Grade Maths
*Topic: Chance and Probability exploring the vocabulary of likely, unlikely, certain, and impossible* Our reimagined Four Corners is a dynamic classroom game where students respond to questions posed by the teacher by physically moving to one of four corners in the room, each representing a different answer option. It's a fun and interactive way to engage students whilst they learn, and you assess their understanding of the topic. THREE WAYS TO PLAY: Traditional Four CornersUtilise a digital de
Subjects:
Grades:
1st - 3rd
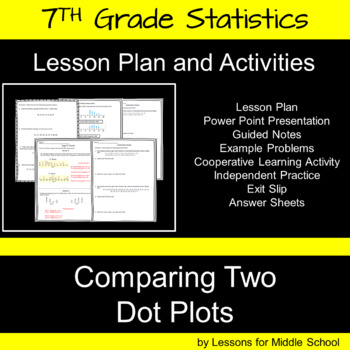
7th Grade Math -Statistics- Comparing Data Shown in Dot Plots
This lesson teaches students how to Compare Data Shown in Two Dot Plots according to the 7th Grade Common Core Math Standards. Students will be presented with data displayed in Dot Plots and students must use measures of central tendency to compare the data to formulate conclusions. Students will examine the spread or statistical range of the data, the center or median, and then they will examine the overall shape of the two dot plots. ABSOLUTELY NO PREP REQUIRED, just download and start teac
Subjects:
Grades:
6th - 8th
CCSS:
Also included in: 7th Grade Math - Probability and Statistics Bundle
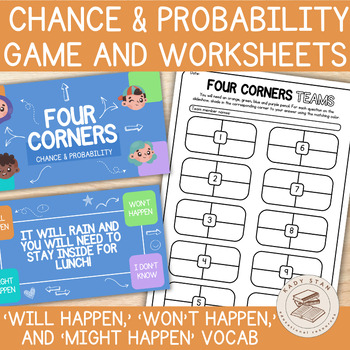
Chance and Probability Game | Slideshow Activity & Worksheets | 1st Grade Maths
*Topic: Chance and Probability exploring the vocabulary of will happen, won’t happen, and might happen* Our reimagined Four Corners is a dynamic classroom game where students respond to questions posed by the teacher by physically moving to one of four corners in the room, each representing a different answer option. It's a fun and interactive way to engage students whilst they learn, and you assess their understanding of the topic. THREE WAYS TO PLAY: Traditional Four CornersUtilise a digital
Subjects:
Grades:
1st - 3rd
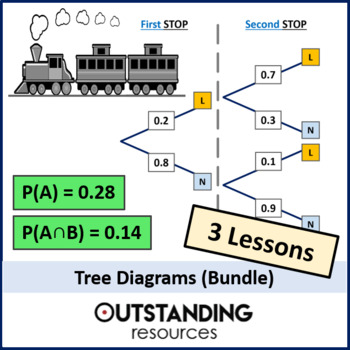
Tree Diagrams Bundle
This is an excellent 3 LESSONS bundle on Tree Diagrams. Looking at all different aspects and problems involving conditional probability. These lessons are ready to go, with no prep required. They are also great for home learning. The lessons are as follows:Lesson 1 - Tree Diagrams with ReplacementLesson 2 - Tree Diagrams without ReplacementLesson 3 - Tree Diagrams and Conditional ProbabilityALSO:1. Please provide a RATING with feedback2. Feel free to browse the Outstanding Resources shop for mo
Subjects:
Grades:
9th - 12th

Mission Series #1: Averaging
Students are placed on a mission to help the teachers of Peace University average their semester grades. They are given five teacher gradebooks and asked to find the mean for each student. Guaranteed to make learning fun and engaging! Students feel a sense of adventure as they complete this simple lesson in the form of a quest. They show their understanding of this statistic concept while they fulfill their assignment. Answer Keys included.
Subjects:
Grades:
6th - 8th, Adult Education
Types:
CCSS:
Statistics Unit 1 Bundle - Introduction to Statistics Curriculum (8 days)
Statistics Unit 1 Bundle - Intro to Statistics Curriculum (8 days)This is an Introductory Unit for a Statistics class. The plans include common core math standards, time frame, activities, enduring understandings, essential questions, and resources used. It is designed to last 8 days, depending on pacing. The plans include: 22-slide presentation, with annotated guide for reference2 Worksheets"Do Now" Entrance problemsUnit ReviewUnit QuizUnit 1 Project - Gathering DataPacing guide with administra
Subjects:
Grades:
9th - 12th, Higher Education
CCSS:

Mission 2: Backwards Averaging
This packet asks students to go on a mission to help the monsters at Peace University know where best to spend their time studying for exams. Three monsters reveal the grades they have made in each of their four classes and ask the student to find out what is the minimum grade they would need to make on each subject's exam in order to get a 90% (an A) in all of their classes.As part of the instructions for the quest, a secret for solving these types of problems is revealed. As it is explained
Subjects:
Grades:
6th, Adult Education
Types:
CCSS:
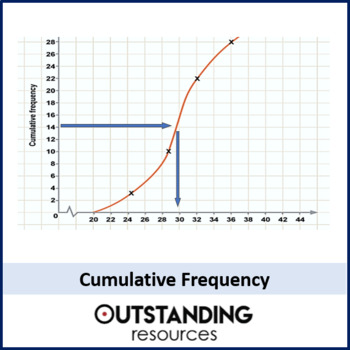
Cumulative Frequency and Cumulative Frequency Graphs
This is a whole lesson on Cumulative Frequency, Median and Quartiles and using cumulative frequency graphs to find the median and interquartile range (IQR). The next lesson is box plots, which builds on this lesson and is also available and both work very well together. This lesson is ready to go and requires no additional prep. It is also great for home learning. 20-slide presentation + lots of supplementary resources.It comes with:+ Starter+ Learning Objectives (differentiated)+ keywords+ MWB
Subjects:
Grades:
7th - 11th
Also included in: Statistics ALL LESSONS
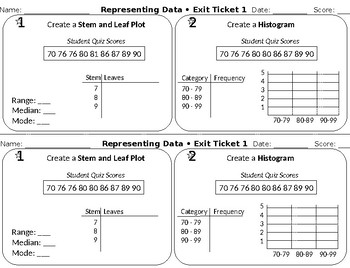
Representing Data - Dot Plot - Box Plot - Stem Leaf Plot - Histogram
Representing Data - Dot Plot - Box Plot - Stem Leaf Plot - Histogram
Texas TEKS
Subjects:
Grades:
6th - 7th
Showing 1-24 of 144 results


