19 results
Statistics simulations for Microsoft Word
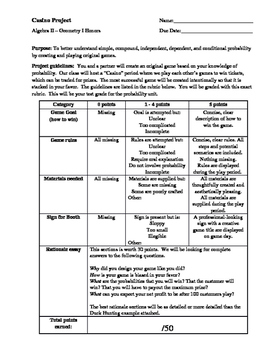
Carnival Probability Project
A project that feels like a game!
Students must create their own game, using probability to ensure THEY are favored to win....much like the house in a casino. Students can make games involving dice, spinners, cards, "fishing" ducks out of a pond, etc.
Assessed skills include: fundamental counting principal, theoretical probability, experimental probability, independent events, dependent events, creativity, writing, presentation. *Students must already know basic probability to complete this
Subjects:
Grades:
8th - 12th
Types:
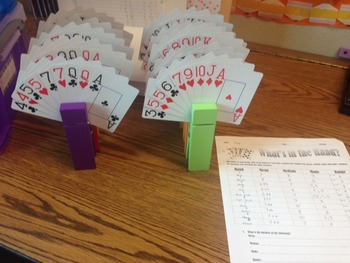
Statistics Mode, Median, Mean, Range Worksheet for Math or Psychology
What's in the Hand: Activity makes learning mode, median, mean, and range fun. You will need two packs of playing cards in order to use 10 different variations. I use giant clothes pins to hold a total of 9 cards for each station. Each student gets a worksheet and is assigned to a group of 4-5 students. Students will complete the first rotation by figuring the mean, median, mode, and range, and then rotate to each other station in about 5 min intervals. At the end they will answer the questions
Subjects:
Grades:
5th - 12th
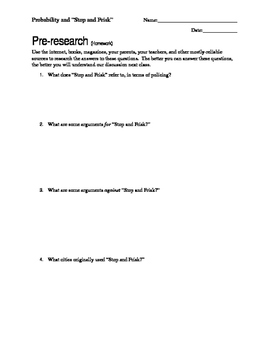
Using Probability to Teach Social Justice
This is an exploratory experiment/activity about basic probability. Students discover the differences between theoretical probability, experimental probability, and reality by taking a hard look at Stop and Frisk in urban areas. Students also deal with independent and dependent events.
By the end of the project, students will be able to:
Articulate the differences between theoretical and experimental probability through prediction and experimentation.
Articulate the differences between indep
Subjects:
Grades:
8th - 12th
Types:
CCSS:
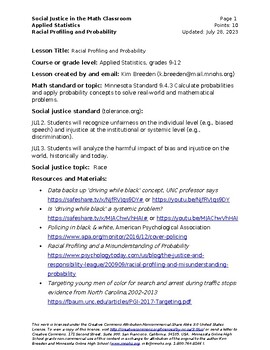
Racial Profiling and Probability (Social Justice Math)
In this assignment, you will investigate racial profiling, or Driving While Black (DWB). African Americans and Latinos/as have complained, filed suit, and organized against what they believe are racist police practices—being stopped, searched, harassed, and arrested because they “fit” a racial profile—they are African American (Black) or Latino/a (Brown). But is this true? How do we know? And can mathematics be a useful tool in helping us answer this question?These questions will be answered usi
Subjects:
Grades:
7th - 12th
Halloween Party - Math Problem Solving
In this activity, students will be planning a Halloween party for their class. They will need to "purchase" supplies for their party using a budget that you set. I set a budget that forces the students to make budget choices, i.e., I don't give them enough to buy everything they want. Students will work in partners to plan their party, making decisions based on their budget constraints. Students are also asked to perform some data analysis on the party choices. This is a good activity to do
Subjects:
Grades:
3rd - 7th
Calculator Simulations for Probability and Statistics
If you are obliged to follow a mandated math curriculum at your school, then I suggest you read no further because this site is probably not suitable for you. However, if you are looking for something that is different, yet might spark an interest in either you or your students, then it might be worthwhile for you to continue reading.In 1994 I wrote an alternative curriculum for our Probability and Statistics students that employed Monte Carlo simulations. The students’ reactions were so positi
Subjects:
Grades:
10th - 12th
Types:
Interactive Online ELab Simulations Lab - Shopping Unit Rates Lab
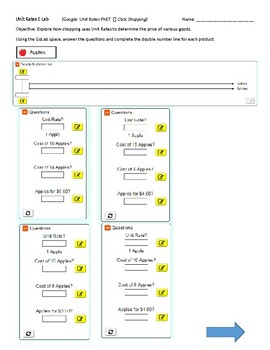
In this FREE online interactive simulation provided by PhET, developed by the University of Colorado, students will explore unit rates through the process of buying goods. Students will explore how shopping uses unit rates to determine the price of various goods. Students will need a computer, tablet or IPad. These simulations were designed for IPad use. This handout goes directly with the Elab and contains directions on accessing the lab online as well as directions on how to complete the lab.
Subjects:
Grades:
5th - 8th
Types:
Trouble with Probability
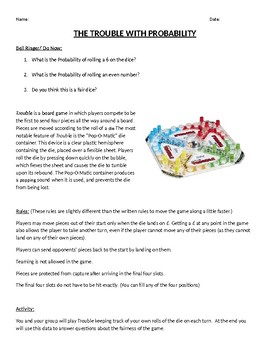
Students will use the popper board game to study the probability of a fair dice.They will play a (speed-up) version of the classic board game to determine how many times each number of a die appears. They will calculate the percentage of occurrence of each number to determine if the die is fair. Follow up questions about how to change the probability of the die are also included as either homework or an extension of the activity.
Subjects:
Grades:
5th - 8th
Types:
CCSS:

A Fishy Situation
The multiple day activity is a simulation requiring students to collect, organize, categorize, and analyze data concerning a fish population in a lake. Students will discuss sampling, create various graphs, and create their own research plan. Career ties may be biologist, state wildlife and fisheries agents, and environmentalist.
Subjects:
Grades:
6th - 8th
Types:
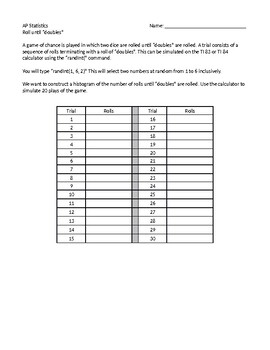
AP Statistics: Rolling Doubles Activity
Students use the random number generator on their calculators to simulate dice rolls. Students graph and describe the results. Students answer follow-up questions regarding mean versus median as well as the expected value.
Subjects:
Grades:
10th - 12th
Types:
CCSS:
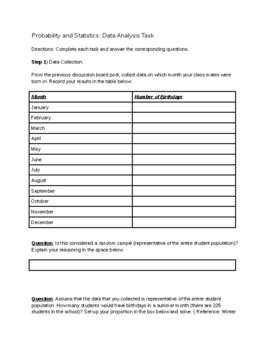
Birthday Probability: Data Analysis Task/Project
This great project is specifically designed for use during the Statistics and Probability unit for 7th grade. Purchase of this product will provide you with a fully editable document that you can edit to your liking.
Subjects:
Grades:
6th - 8th
Types:
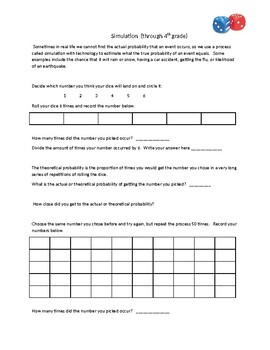
Probability Intro to simulation using dice
This is the perfect introductory activity to simulation and probability. It could be used in Algebra 2 and basic Statistics courses. It could also be used in 6th through 8th grade to introduce probability.
Subjects:
Grades:
6th - 12th
Snack Cakes: Group Task Random Variables_Discrete Var_Normal Approx. (editable)
Group Task Involving CAKE!!!!Targeted Skills:1. Interpret Statistical Calculations2. Determine Models and Parameters3. Assign Meanings and Assess Claims4. Determine Calculations Targeted Topics:1. Random Variables and Combinations2. Probability Distributions-Binomial and Geometric3. Mean and Standard Deviation of Random Variables4. Normal Approximations for Binomial DistributionsWhat is Included in this document?1. Task2. Sample Solution with Point Values and Scoring Guide3. Directions for imple
Subjects:
Grades:
9th - 12th, Higher Education, Adult Education
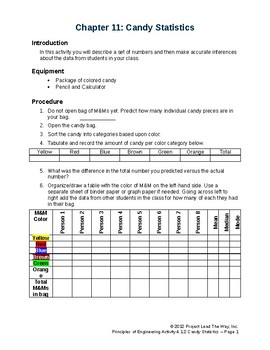
Candy Statistics
Kids have a chance to open individual bags of M&Ms and practice calculating probability of different colors and solving probability problems both independent and dependent.
Subjects:
Grades:
9th - 12th
Types:
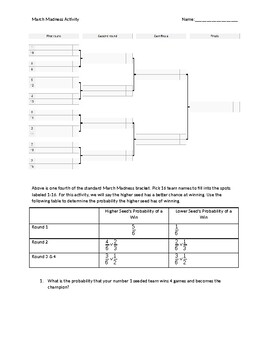
March "Math"ness Probability
I designed this activity to show how likely making a perfect bracket really is. It engages students in a fun probability activity where they can calculate a probability and also see probability in action. Students have to pick 16 teams (real or fictional) and determine who they think the winners will be in each game. After answering a few probability questions, they will use a die to determine the winners of each game. Then they will see if they would have won a bracket challenge.
Subjects:
Grades:
9th - 12th
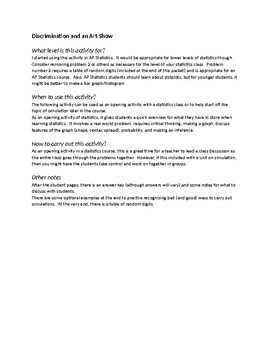
Simulation Intro Activity for AP Statistics (or lower)
This activity can be used to kick-off a statistics course or used later when introducing simulation as part of a probability unit. The theme is that names were randomly drawn out of a hat to see which students will have their paintings included in an art show. When a significant amount of females were selected, some of the males cried discrimination! So this problem has students discuss different ways to carry out a simulation (use a deck of cards, a random number generator, or a table of ran
Subjects:
Grades:
9th - 12th, Higher Education
Types:
CCSS:
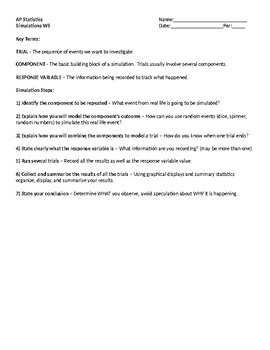
AP Statistics: Simulation Lab Worksheet
This activity provides the basics of creating and running a random simulation. There are key terms as well as a defined procedure to follow. The questions are scaffolded to assist in completion and the level of scaffolding decreases as the worksheet progresses. AP Statistics Unit 3: Collecting Data.
Subjects:
Grades:
10th - 12th
CCSS:

Design and Use a Simulation to Generate Compound Event Frequencies
7th Grade Standard 7-SP8c
The activity includes step by step instructions for using TI-73 or TI-83/84 graphing calculators and random digits as a simulation tool to approximate the answer to the question: If 40% of donors have type A blood, what is the probability that it will take at least 4 donors to find one with type A blood?
Subjects:
Grades:
7th
Types:
CCSS:
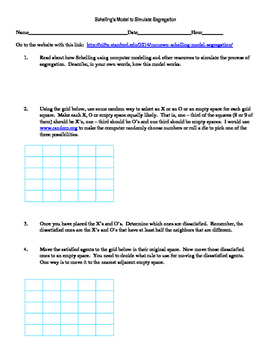
Schelling Model of Segregation using McCown's Simulation
This mini problem focuses on using models to simulate a known event. The questions emphasize having students make observations about the outcomes of a model.
Subjects:
Grades:
10th - 12th, Higher Education
Types:
Showing 1-19 of 19 results


