35 results
3rd grade statistics worksheets for Microsoft Word
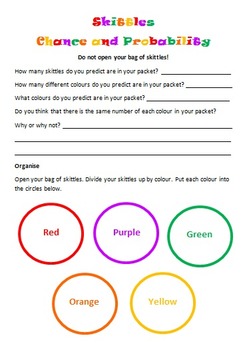
Skittles Chance and Probability (Editable)
Chance and Probability activity using yummy Skittles!!!
Students are to predict the colours and quantities before they open the skittles bag. Students are to complete a chance experiment where they use a tally to collect their data. Students then transfer their data in fractions, decimals and percentages. Students are to create a bar graph using their data as well as answer chance and probability questions about the data. I used this with my grade 5/6 students and they loved it!
Subjects:
Grades:
3rd - 10th
Types:
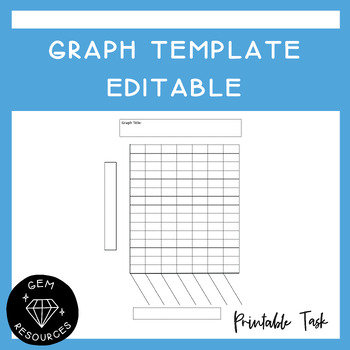
Graph Template Data and Statistics Maths Histogram Bar Column Drawing Editable
Students can use this to help them draw up a graph. It allows them to be accurate and has boxes for the titles needed for the graph.This Word document is editable.
Subjects:
Grades:
2nd - 6th
Types:
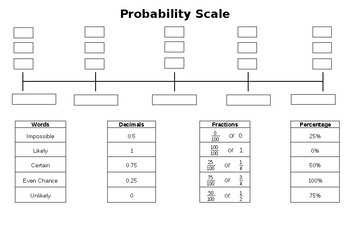
Probability Scale (Editable)
Students are to write the:
- Fractions
- Decimals
- Percentages
- Words
on the correct section of the probability scale.
Subjects:
Grades:
3rd - 8th
Types:
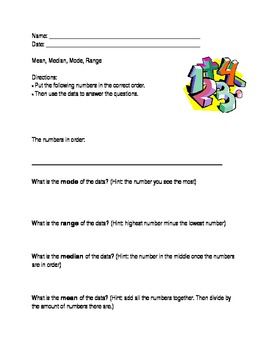
Mean, Median, Mode, Range; Modified Special Ed Math Template; Statistics
This is a modified worksheet from the middle school statistics curriculum. It is excellent for special education students who require an alternate or modified curriculum.
This worksheet allows teachers to input numbers in the blank space. This way teachers can use the template over and over with different numbers. Students are then to write the numbers in the correct order. Then, they have to find the mean, median, range, and mode. There are "hints" (formulas) that help the students differentia
Grades:
PreK - 12th
Types:
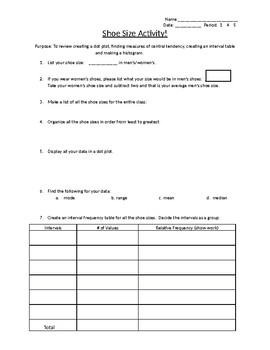
Shoe size group activity! Review dot plots and histograms.
This activity was created as a review for creating a dot plot, finding measures of central tendency, creating an interval table and making a histogram. All these items are covered in this group activity for your class! Kids enjoy working together while reviewing and learning all at one time.This is a word document that you change change anyway to fit your classes needs.
Subjects:
Grades:
3rd - 12th
Types:
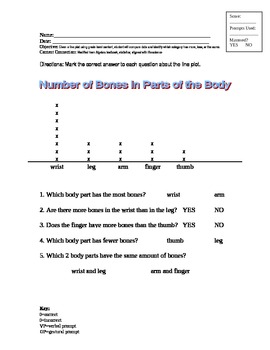
Reading a Line Plot; Modified Curriculum for Special Ed, Statistics
This line plot is modified from the middle school statistics curriculum. It is excellent for special education students who require an alternate or modified curriculum. The line plot is related to life science, and shows how many bones are in five different parts of the body. The questions on the worksheet ask questions about more and less. The answers are offered in a field of two.
This worksheet aligns with Maryland content standard:
Given a line plot using grade level content, student will c
Subjects:
Grades:
PreK - 5th
Types:
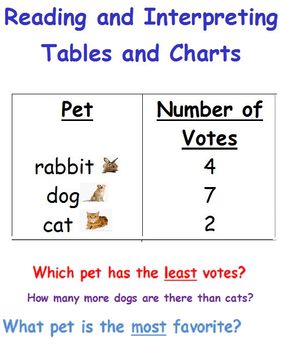
Reading a Table-Data and Statistics-First Grade
There are 4 different worksheets in which students can interpret the data of various tables. I hope they are of help to you! :)
Subjects:
Grades:
K - 3rd
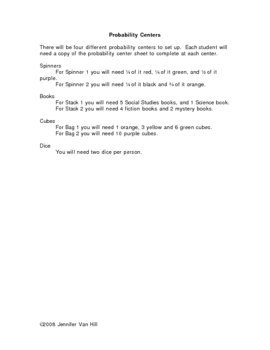
Probability Centers
This is a set of four probability activities that can be used individually or as centers. Students complete the activity and identify the probability of certain outcomes as likely, unlikely, certain or impossible.
Jennifer Van Hill
Subjects:
Grades:
3rd - 5th
Types:
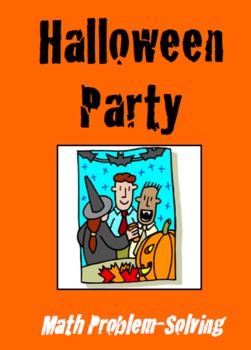
Halloween Party - Math Problem Solving
In this activity, students will be planning a Halloween party for their class. They will need to "purchase" supplies for their party using a budget that you set. I set a budget that forces the students to make budget choices, i.e., I don't give them enough to buy everything they want. Students will work in partners to plan their party, making decisions based on their budget constraints. Students are also asked to perform some data analysis on the party choices. This is a good activity to do
Subjects:
Grades:
3rd - 7th
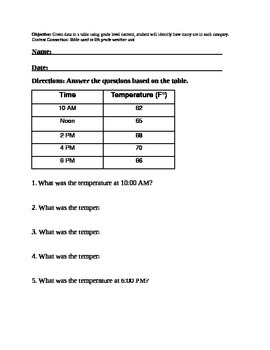
Reading Data in Table: Temperature. Special Ed
Aligns with the following Maryland State Alternate Content Standard:
Given data in a table using grade level content, student will identify how many are in each category.
This is a great assignment to do for homework or as a warm-up.
This worksheets uses a table from the modified curriculum for 6th grade earth and space science, weather.
Subjects:
Grades:
3rd - 12th
Types:
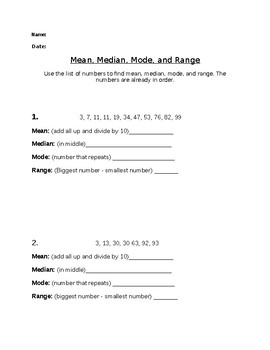
Mean, Median, Mode, and Range
This is a worksheet that allows for practice of mean, median, mode, and range. The numbers are already in order and definitions for each term are provided.
Subjects:
Grades:
3rd - 10th
Types:
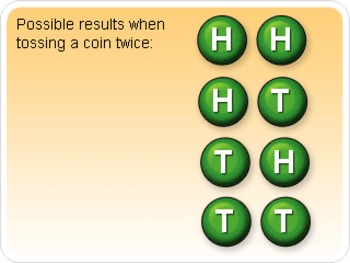
Compound Events Worksheet (10 Q)
Compound Events Worksheet
10 word problems worksheet
Subjects:
Grades:
3rd - 12th, Higher Education, Adult Education, Staff
Types:
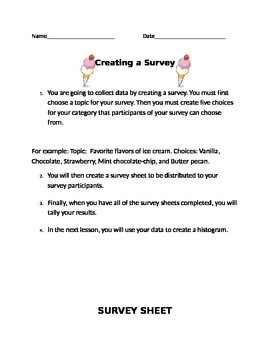
Creating a Survey, Tallying Results and Creating a Histogram, Box Chart
This activity includes a general student instruction sheet, a brainstorming activity to choose categories for students' survey topics, a blank survey sheet to be filled out and distributed to the population sample, a worksheet to tally the results of the survey and a worksheet to create a histogram or box plot for the survey results. This activity may be completed individually or in small groups.
Subjects:
Grades:
3rd - 6th
Types:
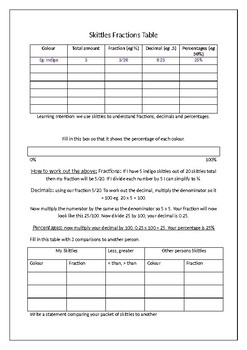
Skittles Fractions and decimals table
In this activity each of the students is given 20 skittles at random. They have to insert the amount and colours into their table. The object of the investigation is to then try and work out the fractions, decimals and percentages of each of their different colours of skittles.
Their are a series of questions and activities related to ratios of skittles to their fractions that the students can complete if they are at a higher level.
The students loved this activity especially when they found o
Subjects:
Grades:
3rd - 8th
Types:
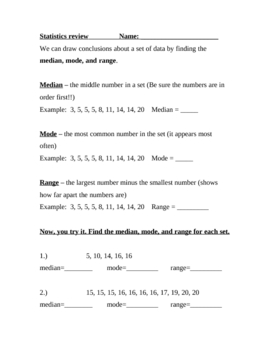
Median Mode Range Statistics Review Math Worksheet
This is a teacher-created 2-page review sheet on median, mode, and range. It includes explanations and examples with practice problems and 2 thought-provoking challenge questions. Answer key is now included.
Subjects:
Grades:
3rd - 6th
Types:
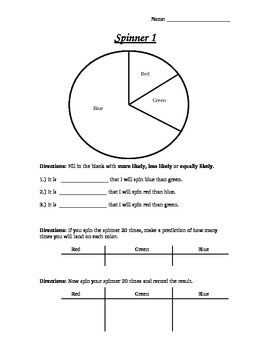
Probability Spinner Worksheets
Students color their own spinners and test out theories and predictions. There are three different activities in the pack. The lines and spinners do not line up correctly on preview but do on the document.
Subjects:
Grades:
2nd - 3rd
Types:
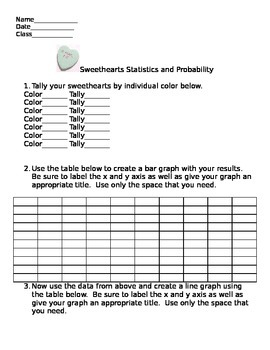
Learning Statistics and Probability using Sweethearts Candy
This is a math lesson I created called Learning Statistics and Probability using Sweethearts Candy. This is an excellent introduction to the concept of statistics and probability, or as a reinforcement of the concept. It is great to do around Valentine's Day.
Subjects:
Grades:
3rd - 5th
Types:
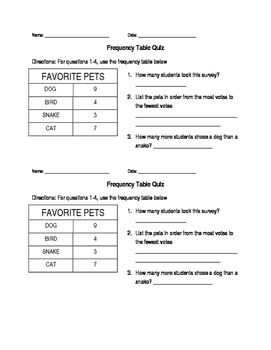
Math Frequency Table Quiz grades 1-3
This quiz is for students in grade 1, grade 2 and grade 3. The quiz has a frequency table on it and then it asks the students questions about the frequency table.
Subjects:
Grades:
1st - 3rd
Types:
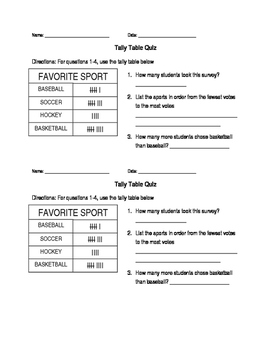
Math tally table quiz
This math tally table quiz can be used for 1st, 2nd or 3rd grade students. The quiz shows students a tally table and then asks them questions about the tally table.
Subjects:
Grades:
1st - 3rd
Types:
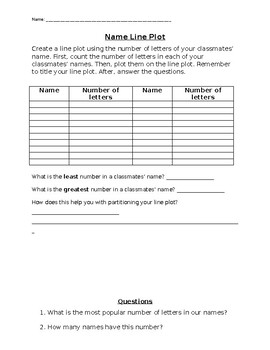
Line Plots with classmates' names
Have your students create a line plot with their classmates' names. Just type (or write) in your class list and copy!
Subjects:
Grades:
2nd - 5th
Types:
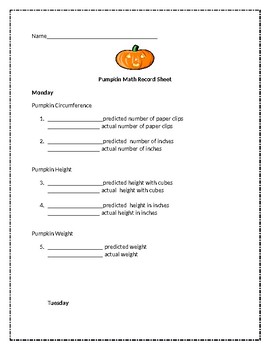
Pumpkin Math (Week Long Activities)
Throughout this fun filled week, children will explore:
-Circumference
-Weight
-Volume
- Distance
These are different hands on activities for each day of the week (Mon-Thurs)
Subjects:
Grades:
1st - 4th
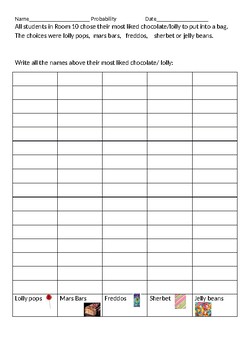
Grade 2/3 Chance Probability Activity
Students will collect data from the class, show the probability using fractions, drawings and a probability line as well as graph the results
Subjects:
Grades:
1st - 4th
Types:
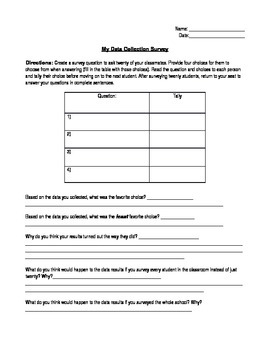
Data Collection Survey
This is a short survey where students are in charge of coming up with a question and surveying their classmates. They fill in the data as they collect it and analyze the data by answer questions at the end. It would be great at the beginning of the scientific method unit.
Subjects:
Grades:
3rd - 5th
Types:
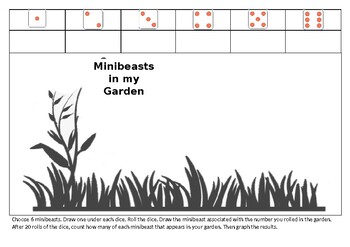
Minibeast Chance and data actitivity
Using the attached template, students work independently to collect and record data. This activity is suitable for Reception to Year 2. Choose 6 minibeasts. Draw one under each dice. Roll the dice. Draw the minibeast associated with the number you rolled in the garden. After 20 rolls of the dice, count how many of each minibeast that appears in your garden. Then graph the results.
Subjects:
Grades:
1st - 3rd
Types:
Showing 1-24 of 35 results


