172 results
Statistics printables for Microsoft Word
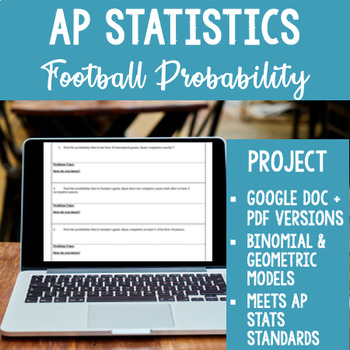
AP Statistics Football Binomial + Geometric Probability Project Digital + PDF
NEW for 2020! This resource now includes a fully editable Google Doc link for remote or distance learning! Assign the Google doc to your students, and they can type their answers directly into the boxes and submit their work digitally. This packet includes the following: Seven probability questions that use football quarterback pass completion rate, and require the use of the following probability techniques to answer: · Geometric PDF · Geometric CDF · Complement of Geometric CDF ·
Subjects:
Grades:
10th - 12th
Types:
Also included in: AP Statistics Project Bundle! 6 Projects + digital versions

Safe Cracker - Mean, Median, Mode, & Outliers - Math Fun!
Do your students get excited when you tell them it's time to study outliers and measures of center? Of course they don't.
But they will if you use this fun, Safe Cracker worksheet!
Students can become world famous safe crackers! Your students will use the clues and their math skills to help crack the safes, in order to claim the prizes found inside.
Students are given three "clues", which involve outliers and measures of center (mean, median, and mode). The answers become the numbers in the
Subjects:
Grades:
5th - 8th
Types:
CCSS:
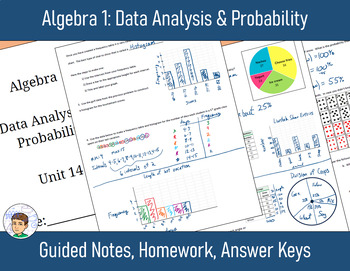
Algebra 1 Unit 14: Data Analysis & Probability - Notes, Homework, Answers
This unit is a great resource for any math course looking to add a supplementary unit on Data Analysis and Probability. You are buying guided notes, notes keys, homework assignments, and answers for a 6 lesson unit. This unit is based on a traditional Algebra 1 curriculum.Please check out the preview file to see what the unit will look like.This Word document makes it easy for you to modify, edit, or copy and paste to make your own reviews and tests for the unit.Topics covered in this unit are:R
Subjects:
Grades:
7th - 10th
Types:
Permutations and Factorial Notation Worksheet (17 Questions)
Permutations and Factorial Notation Worksheet17 Questions with the solutions1 page for the questions1 page for the answers* AlSO AVAILABLE FOR YOU OR A COLLEAGUE! - CLICK ANY LINK YOU WANT:Probability & OddsMean, median, mode, range, line plot, and Box and whisker WorksheetStatistical Math (GED REVIEW)The Binomial Theorem Worksheet (10Q)Theoretical Probability WorksheetProbability Word Problems (Worksheet) You may also be interested in my other top-selling products: EQUIVALENT FRACTIONS (33
Subjects:
Grades:
9th - 12th, Higher Education, Adult Education, Staff
Types:
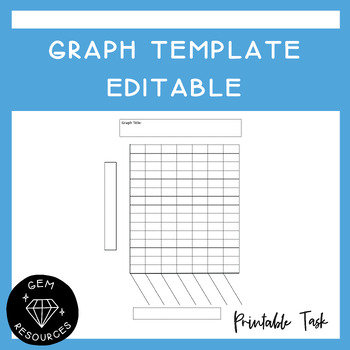
Graph Template Data and Statistics Maths Histogram Bar Column Drawing Editable
Students can use this to help them draw up a graph. It allows them to be accurate and has boxes for the titles needed for the graph.This Word document is editable.
Subjects:
Grades:
2nd - 6th
Types:
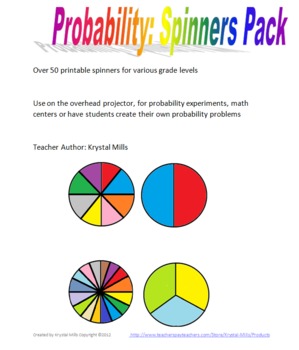
Probability Spinners Pack
This resource includes spinners for probability problems and experiments that could be used in various grades.
Included:
-blank spinners (2,3,4,5,6,8,10 and 16 spaces)
-numbered spinners (2,3,4,5,6,8, and 10 spaces)
-printable sheets (4 spinners to a page) of blank spinners with 2,3,4,5,6,8,10 and 16 spaces
-colored spinners (2,3,4,5,6,8,10 and 16 spaces)
Over 50 spinners that can be used with various grades and for various activities. Ready to print and go!
Teacher Author: Krystal Mills
pr
Subjects:
Grades:
3rd - 8th
Types:
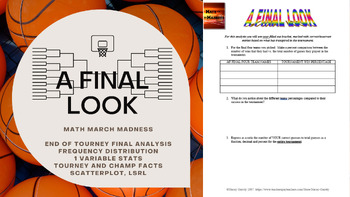
Math March Madness - A Final Look (Freq Distributions, Stats, Regression Lines)
Fill out a bracket, watch the tournament unfold and then mathematically analyze how you did! This activity is flexible enough to be used for a variety of levels. I have used all 6 pages for an AP Statistics class, and have used pages 1 through 5 for an Algebra or Algebra 2 class. You could even use it in lower levels as long as you are covering percents, and basic stats like mean, median, mode and graphing. The document is editable so you can adjust/delete to tailor to the level of statistic
Subjects:
Grades:
4th - 12th, Higher Education
Types:
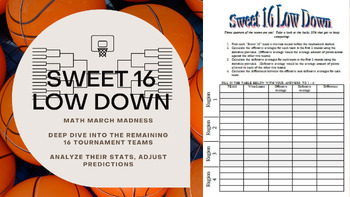
Math March Madness - Sweet 16 Low Down (Statistics Analysis of Final 16 Teams)
Join in the fun of the NCAA tournament at the Sweet 16 round! In this activity students analyze win percentages of the remaining 16 teams as well as research and compute their average offense and defense. This editable activity also asks students to analyze math presented in the real world by finding media and articles that use statistics to further their arguments.This can be used independently or check out these other items in my store for a comprehensive March Madness Project!Math March Mad
Subjects:
Grades:
4th - 12th, Higher Education
Types:
CCSS:
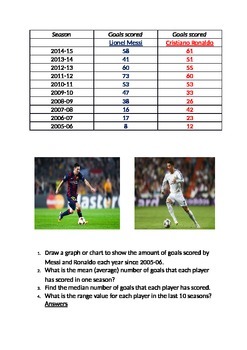
Messi v Ronaldo - mean, mode, median, range.
Data handling with a soccer twist. Find the mean, median, mode and range of the goals scored by the extraordinary Lionel Messi and Cristiano Ronaldo over the last 10 years, and create a variety of graphs and charts in the process.
Subjects:
Grades:
5th - 12th
Types:
Under the Boardwalk: The Monopoly Story (Amazon Prime)
This simple video guide accompanies the documentary film "Under the Boardwalk: The Monopoly Story" (Amazon Prime) which details the history of the game and the social phenomenon it has become, all against the backdrop of the 2009 World Championships. This guide will help students engage with the film and stay on task throughout the presentation. Answer key included with timestamps.
Grades:
5th - 12th
Types:
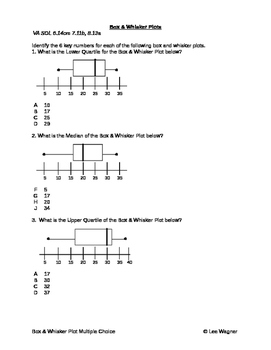
BOX & WHISKER PLOT MULTIPLE CHOICE
Box and Whisker plot multiple choice worksheet. Covers extremes, quartiles, medians, outliers, and percentages.
Subjects:
Grades:
6th - 8th
Types:
INTERPRETING AND CREATING LINE GRAPHS
Are you looking for a quick way to assess your students' mastery of double line graphs? Here it is! This can be used to practice creating double line graphs or to determine previous learning. It is ready to go! I would use it in all middle school grades maybe even lower if students are ready! This activity could also be changed to practice double bar graphs, if you want to extend the learning. It could also be used for substitute work in upper grades. It is a great way to teach creating graphs i
Subjects:
Grades:
5th - 8th
Types:
Netflix Money Explained Episode 4: Gambling
This simple and straight forward video guide contains 12 questions and will help students engage with the content while staying on task. This episode explores the relationship between humans and gambling, and how it has gotten even more complicated over the years. *Answer key with time-remaining stamps included
Grades:
8th - 12th
Also included in: Netflix Money Explained Complete Series
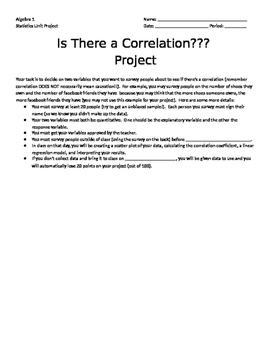
Correlation Project
This is a project I have done at the end of a Statistics unit in Algebra 1. Students survey at least 20 people with two quantitative questions and do a correlation study. The students make a scatter plot and find the line of best fit. Then, they find the linear regression and r value in a calculator and interpret them.
Subjects:
Grades:
9th - 11th
Types:
CCSS:
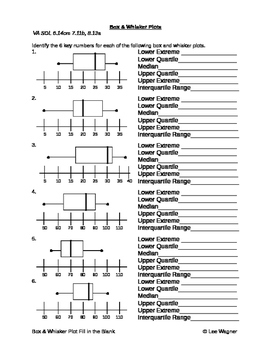
BOX & WHISKER PLOT FILL IN THE BLANK
Fill in the blank worksheet. Box & Whisker plots (extremes, quartiles, median, outliers, and percentages).
Subjects:
Grades:
6th - 8th
Types:
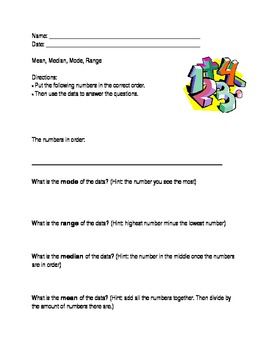
Mean, Median, Mode, Range; Modified Special Ed Math Template; Statistics
This is a modified worksheet from the middle school statistics curriculum. It is excellent for special education students who require an alternate or modified curriculum.
This worksheet allows teachers to input numbers in the blank space. This way teachers can use the template over and over with different numbers. Students are then to write the numbers in the correct order. Then, they have to find the mean, median, range, and mode. There are "hints" (formulas) that help the students differentia
Grades:
PreK - 12th
Types:
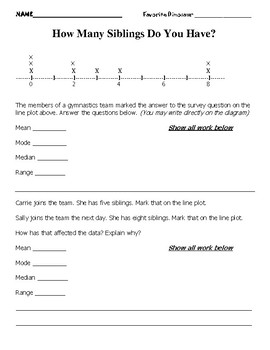
Line Plot Data Display Mode Median Mean Range TEST PREP #1
This is a data display worksheet that involves desegregating data from a line plot when finding the mode, median, mean, and range of various values. LINE PLOTS have been a focal point on my math standards here in Indiana. Use this worksheet to help prepare students for statewide assessments. Answer key included.
Subjects:
Grades:
5th - 6th
Types:
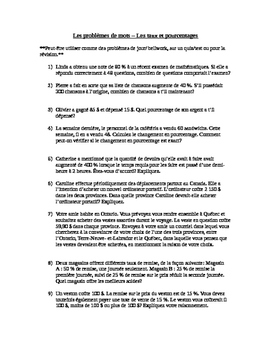
FRENCH math- Les pourcentages, rapports et taux - rates, percentages and ratios
17 FRENCH word problems that can be used for Bellwork, problem of the day or on a quiz or test. Made to go along with the percentages, ratios and rates unit in Ontario.
**Peut-être utiliser comme des problèmes de jour/ bellwork, sur un quiz/test ou pour la révision.**
Subjects:
Grades:
7th - 10th
Types:

Printable Box-and-Whisker Plot 2012 Top Movies Fun Algebra Activity
This Printable lists the 15 top grossing movies of 2012. Students are to create a Box-and-Whisker plot or boxplot of the data. Hopefully they will enjoy reminiscing about movies they have seen in the past. Since there are 15 movies, the data is very easy to work with and no averages are needed. To make the problem more complicated, just eliminate one of the movies. There is an answer key provided for the 15 movies. I hope your students have fun!
Thank you for purchasing my product. Please
Subjects:
Grades:
5th - 11th
Types:
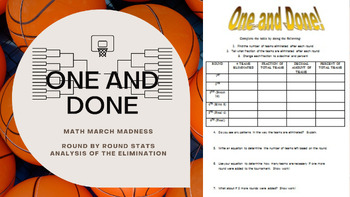
Math March Madness - One and Done! (Statistics of the Elimination Analysis)
Take a look at the "one and done" elimination element of the NCAA tournament! Students analyze probability, and write equations to describe the relationship of teams left in the tournament.This activity can be used independently during the tournament or any other time throughout the year. It can also be used in conjunction with my other March Madness activities for a comprehensive unit! Check out my store for more!Check out these other items in my store for a comprehensive March Madness Proje
Subjects:
Grades:
6th - 12th, Higher Education
Types:
CCSS:
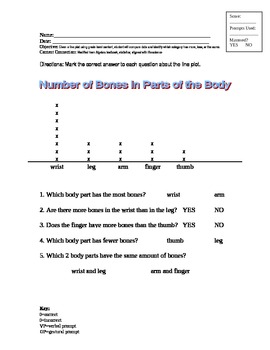
Reading a Line Plot; Modified Curriculum for Special Ed, Statistics
This line plot is modified from the middle school statistics curriculum. It is excellent for special education students who require an alternate or modified curriculum. The line plot is related to life science, and shows how many bones are in five different parts of the body. The questions on the worksheet ask questions about more and less. The answers are offered in a field of two.
This worksheet aligns with Maryland content standard:
Given a line plot using grade level content, student will c
Subjects:
Grades:
PreK - 5th
Types:
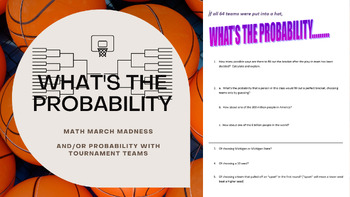
Math March Madness - What's the Probability (and/or Conditional Probability)
A good excuse to talk tournament! This activity asks probability and conditional probability ("and"/"or") questions with a March Madness theme! It assumes that all teams are put into a hat - so they have even probabilities. You may want to discuss how the tournament is set up and define terms like "seed", "upset" and "conference" - or let students do some quick research to learn more. This item is editable so you can choose your own regional teams. On occasion I've streamed the tournament g
Subjects:
Grades:
6th - 12th, Higher Education
Types:
CCSS:
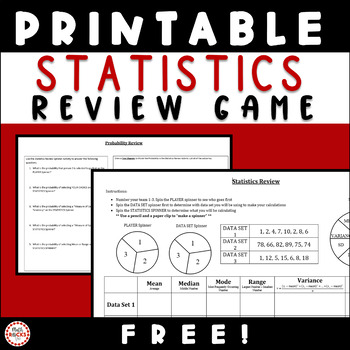
Statistics Review Activity FREEBIE| Mean Median Mode Variance Standard Deviation
Here is a fun way for your students to practice making statistical analysis calculations including mean, median, mode, variance, and standard deviation. INSTRUCTIONS:Use a paper clip and pencil as the spinner. Spin to determine which problem each student is responsible for solving. Mean, Median, Mode, Variance & Standard Deviation.Formulas are provided on the sheet. Page 2 - Probability extension - Drawing tree diagrams and answering theoretical probability questions based on the spinners.Pr
Subjects:
Grades:
10th - 12th
Types:
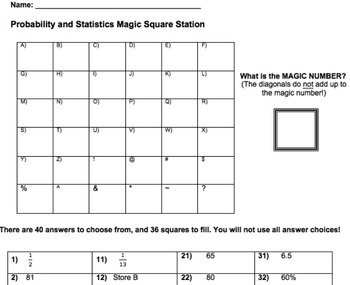
Probability and Statistics Magic Square Activity
This magic square activity is a fun and engaging way to review probability and statistics skills! The students work to solve each problem while also determining what the "magic number" is. The student worksheet and activity are included. My 7th graders loved working on this for an end of the year review assignment!
Subjects:
Grades:
6th - 9th
Types:
Showing 1-24 of 172 results


