13 results
Statistics worksheet images
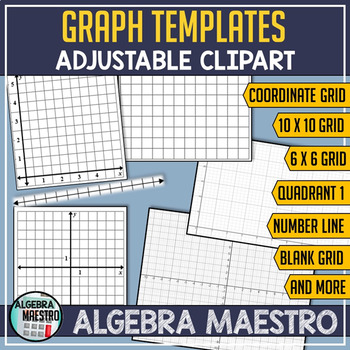
Adjustable Graph Templates
With Adjustable Graph Templates you'll receive a variety of graphs that are formatted to be easily adjustable, this is to help you create your own assignments. The full-page templates can be used as cut-outs, very useful for Foldables, and Interactive Notebooks. There are a variety of graph templates: coordinate axis (axes), 1st quadrant, number line, grid - and with a variety of units and sizes to suit your needs. To adjust a graph - click the desired graph and adjust the size by selecting-
Subjects:
Grades:
Not Grade Specific
Types:
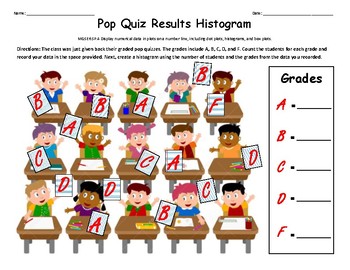
Histogram Pop Quiz
Histogram activity for standard:MGSE6.SP.4 Display numerical data in plots on a number line, including dot plots, histograms, and box plots.
Subjects:
Grades:
5th - 7th
Types:
Statistics Test Review: Inferences About the Slope
Statistics test review covering:
• Confidence intervals
• Correlation of determination
• Prediction & estimation
Students will review learned concepts of inferences about the slope. This review will give students an idea of what concepts they have mastered and what areas they need additional help on to achieve mastery.
• Answer Sheet Included •
===================================================
Related Items:
• Statistics Worksheet: Inferences About the Slope
• Statistics Worksh
Subjects:
Grades:
10th - 12th
Types:
Also included in: Statistics Bundle: Year Long Curriculum

Statistics Worksheet: Inferences About the Slope
Statistics worksheet covering:
• Inferences about the slope
You will receive a worksheet as well as fill in the blank notes with the purchase of this resource. Students will practice the necessary skills of inferences about the slope to be successful in Statistics.
• Answer Sheet Included
===================================================
Related Items:
• Statistics Worksheet: Inferences About the Slope
• Statistics Worksheet: Correlation of Determination
• Statistics Worksheet: Predi
Subjects:
Grades:
10th - 12th
Types:
Also included in: Statistics Bundle: Year Long Curriculum
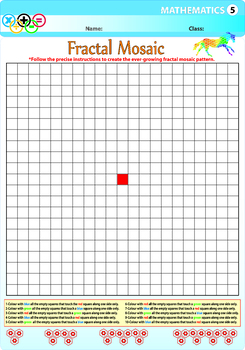
Fractal Mosaic Pattern
All worksheets are high quality (6956 - 9958 pixels) and illustrated.
Subjects:
Grades:
3rd - 5th
Types:
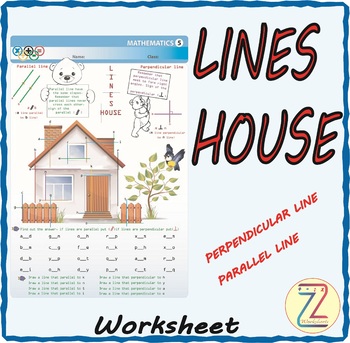
Lines House
Perpendicular line
Parallel Line
Definition of perpendicular and parallel
Finding the answer
Drawing new line
Subjects:
Grades:
1st - 5th
Types:
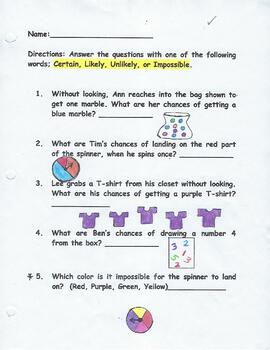
1st Grade Probability
1st graders need to learn whether events are certain, likely, unlikely, or impossible. That is what this sheet focuses on.
Subjects:
Grades:
1st - 2nd
Types:
Graphs
Pie chart
Bar graphs
Line Graphs
All worksheets are high quality (6956 - 9958 pixels) and illustrated.
Subjects:
Grades:
2nd - 5th
Types:
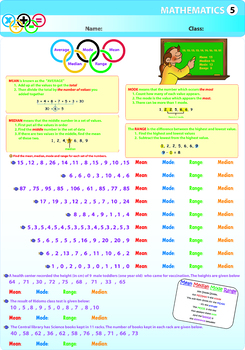
Average , Mode , Median , Range
Pupils can learn the topic and they can do practice
Subjects:
Grades:
4th - 6th
Types:
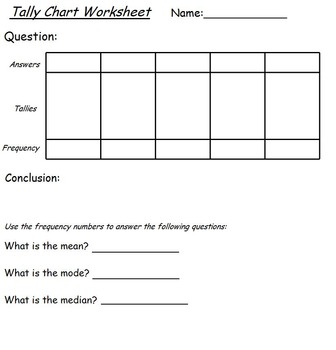
Tally Chart Survey Sheet
As an introduction to tally charts, I have my students develop a question to ask their classmates and then survey their peers, tallying their answers. They find the mean, median, and mode of their tally responses. Later on in the unit, we use this data to create bar graphs and other tables.
Subjects:
Grades:
4th - 6th
Types:

Displaying Data
Stem and Leaf Plots, Mean, Median, Mode, Box-and-Whisker, Line Plot, and Frequency Tables
Subjects:
Grades:
7th - 10th, Adult Education
Types:
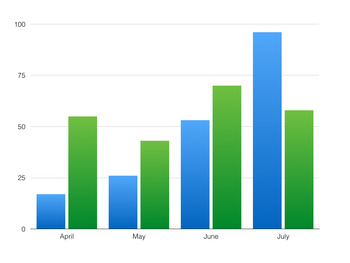
Math- Bar Graph Statistics
This product includes a bar graph with the favorite pets of the 6th and 7th graders at a school, along with 5 corresponding questions to the graph.
Subjects:
Grades:
5th - 7th
Types:
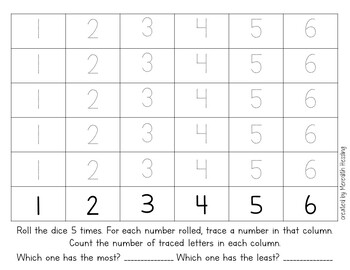
Dice Roll Graphing Exercise
Use this printable worksheet in your classroom to expand on number odds, statistics, and graphing.
Subjects:
Grades:
Not Grade Specific
Types:
Showing 1-13 of 13 results


