70 results
4th grade statistics worksheets for Microsoft Word
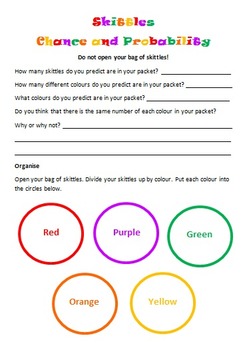
Skittles Chance and Probability (Editable)
Chance and Probability activity using yummy Skittles!!!
Students are to predict the colours and quantities before they open the skittles bag. Students are to complete a chance experiment where they use a tally to collect their data. Students then transfer their data in fractions, decimals and percentages. Students are to create a bar graph using their data as well as answer chance and probability questions about the data. I used this with my grade 5/6 students and they loved it!
Subjects:
Grades:
3rd - 10th
Types:
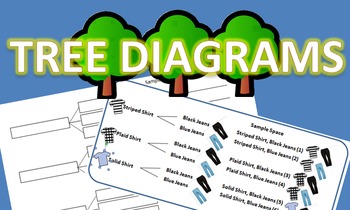
Tree Diagrams Notes and Practice Packet
I created this packet on tree diagrams for my probability unit so that students could work with one another to learn how to create a tree diagram on their own without my direct instruction. This gave me the freedom to help students that needed more individualized instruction and guidance. This packet was great to use before introducing the fundamental counting principle.
Subjects:
Grades:
4th - 9th
Types:
Graph Template Data and Statistics Maths Histogram Bar Column Drawing Editable
Students can use this to help them draw up a graph. It allows them to be accurate and has boxes for the titles needed for the graph.This Word document is editable.
Subjects:
Grades:
2nd - 6th
Types:
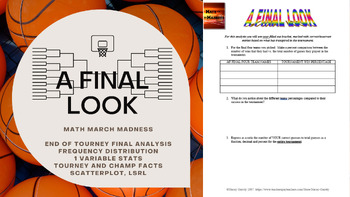
Math March Madness - A Final Look (Freq Distributions, Stats, Regression Lines)
Fill out a bracket, watch the tournament unfold and then mathematically analyze how you did! This activity is flexible enough to be used for a variety of levels. I have used all 6 pages for an AP Statistics class, and have used pages 1 through 5 for an Algebra or Algebra 2 class. You could even use it in lower levels as long as you are covering percents, and basic stats like mean, median, mode and graphing. The document is editable so you can adjust/delete to tailor to the level of statistic
Subjects:
Grades:
4th - 12th, Higher Education
Types:
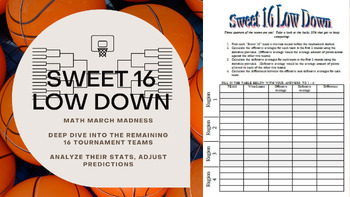
Math March Madness - Sweet 16 Low Down (Statistics Analysis of Final 16 Teams)
Join in the fun of the NCAA tournament at the Sweet 16 round! In this activity students analyze win percentages of the remaining 16 teams as well as research and compute their average offense and defense. This editable activity also asks students to analyze math presented in the real world by finding media and articles that use statistics to further their arguments.This can be used independently or check out these other items in my store for a comprehensive March Madness Project!Math March Mad
Subjects:
Grades:
4th - 12th, Higher Education
Types:
CCSS:
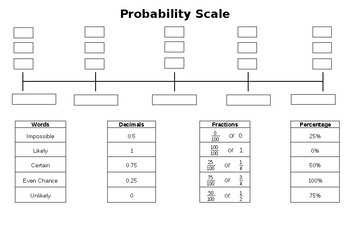
Probability Scale (Editable)
Students are to write the:
- Fractions
- Decimals
- Percentages
- Words
on the correct section of the probability scale.
Subjects:
Grades:
3rd - 8th
Types:
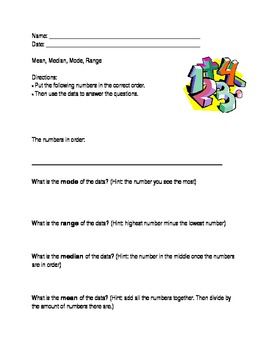
Mean, Median, Mode, Range; Modified Special Ed Math Template; Statistics
This is a modified worksheet from the middle school statistics curriculum. It is excellent for special education students who require an alternate or modified curriculum.
This worksheet allows teachers to input numbers in the blank space. This way teachers can use the template over and over with different numbers. Students are then to write the numbers in the correct order. Then, they have to find the mean, median, range, and mode. There are "hints" (formulas) that help the students differentia
Grades:
PreK - 12th
Types:
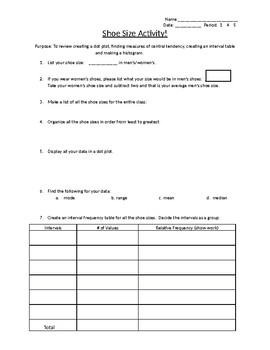
Shoe size group activity! Review dot plots and histograms.
This activity was created as a review for creating a dot plot, finding measures of central tendency, creating an interval table and making a histogram. All these items are covered in this group activity for your class! Kids enjoy working together while reviewing and learning all at one time.This is a word document that you change change anyway to fit your classes needs.
Subjects:
Grades:
3rd - 12th
Types:
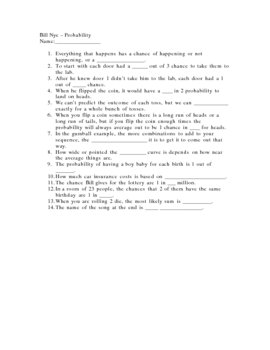
Bill Nye Probability Video Questions
This 14 question video guide with teacher key goes with the Bill Nye Probability video or DVD. This covers many examples of probability and statistics as well as the Bell curve. This could be used in a general science, physical science, biology, life science, chemistry, physics, general math or statistics class. You must have the video or DVD in order to use this product.
Attribution Non-commercial Share Alike
Please check out my other products, including more video questions. I am adding
Subjects:
Grades:
4th - 12th
Types:
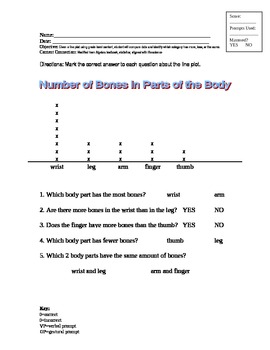
Reading a Line Plot; Modified Curriculum for Special Ed, Statistics
This line plot is modified from the middle school statistics curriculum. It is excellent for special education students who require an alternate or modified curriculum. The line plot is related to life science, and shows how many bones are in five different parts of the body. The questions on the worksheet ask questions about more and less. The answers are offered in a field of two.
This worksheet aligns with Maryland content standard:
Given a line plot using grade level content, student will c
Subjects:
Grades:
PreK - 5th
Types:
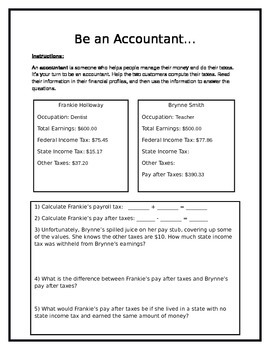
Financial Literacy
This product aligns with the 5th grade financial literacy TEKS. This product could be used as a check for understanding or a partner activity. You could extend this activity by asking the students to create their own personal profile.
Subjects:
Grades:
4th - 6th
Types:
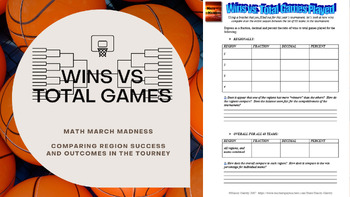
Math March Madness - Wins vs Total Games Played (Comparing Win % by Region)
Compare the teams and fairness of bracketology in the NCAA basketball tournament! Students use a current year bracket and win-loss record of the teams to find and analyze percentages. Answers change each year, but this is what makes things fun to look at! A sample answer key is provided.Practice:- Ratios as Fractions- Converting to Decimals- Converting to Percentages- Analysis for real world interpretationCheck out these other items in my store for a comprehensive March Madness Project!Math M
Subjects:
Grades:
4th - 12th, Higher Education
Types:
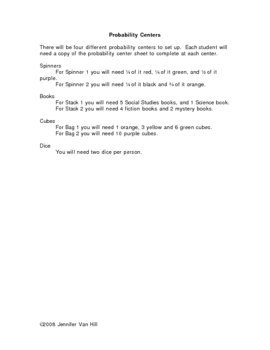
Probability Centers
This is a set of four probability activities that can be used individually or as centers. Students complete the activity and identify the probability of certain outcomes as likely, unlikely, certain or impossible.
Jennifer Van Hill
Subjects:
Grades:
3rd - 5th
Types:
Halloween Party - Math Problem Solving
In this activity, students will be planning a Halloween party for their class. They will need to "purchase" supplies for their party using a budget that you set. I set a budget that forces the students to make budget choices, i.e., I don't give them enough to buy everything they want. Students will work in partners to plan their party, making decisions based on their budget constraints. Students are also asked to perform some data analysis on the party choices. This is a good activity to do
Subjects:
Grades:
3rd - 7th
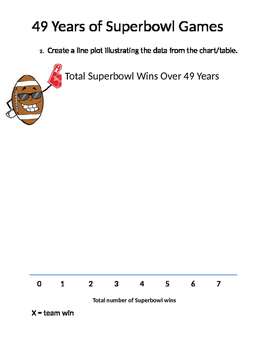
Superbowl Line Plot
Line plot activity that has the students tally all the Super Bowls won over the last 56 years, then they construct a line plot and answer questions.
Subjects:
Grades:
4th - 5th
Types:

Math Probability & Statistics: M&M's Worksheet, Activity, group work
Materials Needed:A bag of plain M&M's for each student (or group of students)Handout for each studentDiscussion before the bags are opened:1. How many M&M's are in each bag?2. How many of each color?3. Will all 6 colors be in each bag?4. Which color will occur the most? the least?Extension:Have students to research the Mars company official percentages for each color.In this activity, students find the probability of choosing a particular color M&M given the number of M&M's in th
Subjects:
Grades:
4th - 10th
Types:
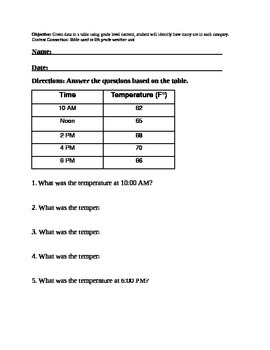
Reading Data in Table: Temperature. Special Ed
Aligns with the following Maryland State Alternate Content Standard:
Given data in a table using grade level content, student will identify how many are in each category.
This is a great assignment to do for homework or as a warm-up.
This worksheets uses a table from the modified curriculum for 6th grade earth and space science, weather.
Subjects:
Grades:
3rd - 12th
Types:
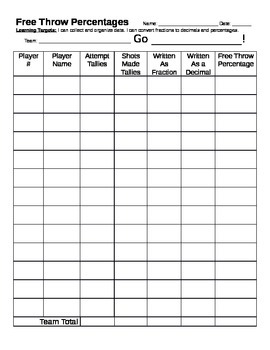
Basketball Game Math
Common Core! Included is a table that helps students calculate free throw percentages in a basketball game (that you don't have to miss)! Students record players' names, numbers, their free throw shot data, and then they use calculators to convert their data to free throw percentages. Real world math! Careers! There are so many ways you could teach this lesson. Students could work with a partner to compare the percentages of each team; one student collects the data for one team, and the other st
Subjects:
Grades:
4th - 7th
Types:
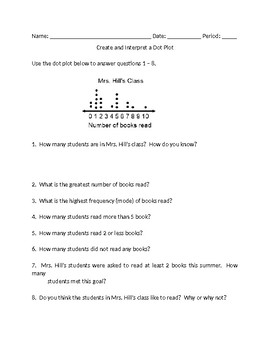
Interpret and Create a Dot Plot
Students will answer 8 questions interpreting a dot pot.
Students will create a dot plot with provided data.
Students will answer 5 questions about the dot plot they created.
Subjects:
Grades:
4th - 6th
Types:
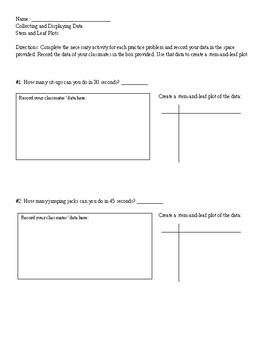
Stem-and-Leaf Plot Activity
In this class activity, students will be collecting data to create a stem-and-leaf plot. The activity should be done in an area where each student has enough space to freely move around. For large classes, it may be best to have the students collect their data for homework and complete the rest of the activity the following school day.
Before beginning the activity, have a timer ready (preferably where the students can see). Under your direction, the students will complete the required activity
Subjects:
Grades:
4th - 8th
Types:
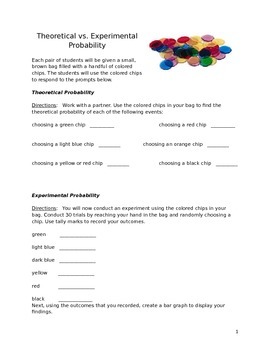
Theoretical vs. Experimental Probability
This is a hands-on activity focusing on theoretical vs. experimental probability. Students will work in partners to complete the activity. Each pair of students will be given a small, brown bag filled with a handful of colored chips. The students will use the colored chips to find the theoretical probability and experimental probability of choosing specific colored chips. The students will then be asked to compare the outcome of the theoretical probability and experimental probability.
This a
Subjects:
Grades:
4th - 9th
Types:

Probability with Graphics
Probability problems that require students to read charts or graphs to set up problems to solve.
Subjects:
Grades:
4th - 6th
Types:
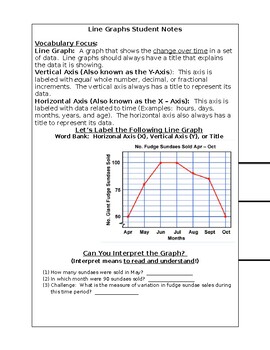
Math Interactive Notebook - Line Graphs (VA SOL 5.14)
Looking for interactive notes for your math classroom? Look no further! This resource is meant to be used in conjunction with other interactive notes (see my Fifth Grade Math Interactive Notebook Bundle). You can cut the notes out to place into a spiral notebook or hole-punch for a 1-inch binder. These notes include model, guided, and independent practice sections, and are editable so that you can make them work for your classroom! The notes align with the Virginia Math SOLs for 5th grade;
Subjects:
Grades:
4th - 6th
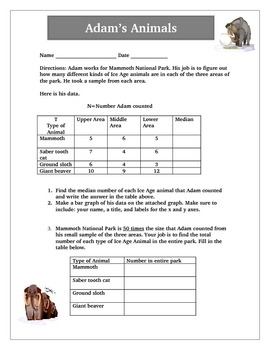
Median and Graphing Math Printables
Creative Math Activity: Median and Graphing Worksheet
Common Core Math Standards: Measurement and Data, Geometry, Mathematical Processes
This creative math activity helps students learn about the concept of median and how to analyze and graph data. Adam works for Mammoth National Park and must find the median number of Ice Age animals in a given area. He then needs to show his results on a graph. Watch the students have fun with this activity. It includes an ANSWER KEY and a rubric as well.
V
Subjects:
Grades:
4th - 9th
Types:
Showing 1-24 of 70 results


