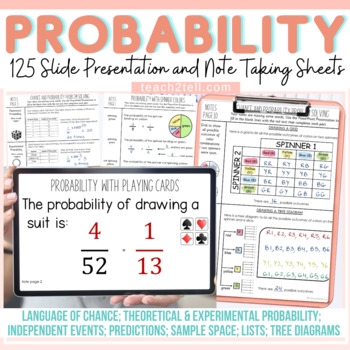
Chance and Probability Activities PowerPoint Presentations and Guided Notes
- Zip
What educators are saying
Also included in
- Are you teaching your students all about chance and probability and looking for fun hands-on probability activities? This print and digital bundle of worksheets, task cards, slideshows and note-taking sheets on Probability will reinforce the understanding of theoretical probability, experimental proPrice $21.00Original Price $41.75Save $20.75
Description
Are you teaching your students all about chance and probability and looking for fun hands-on probability activities? This Probability resource features 125 animated slides and 32 Cornell-style note-taking sheets to make abstract content on Chance and Probability more concrete.
Your students will have a better understanding of theoretical probability, experimental probability, language of chance, sample space, predictions, lists, tree diagrams, and independent probability events.
Both US and British English spelling and terminology included.
Items Included
1. PowerPoint Presentations - 125 Slides
The 125 slide PowerPoint presentation on Chance and Probability is broken down into six separate presentations for ease of use:
- Language of Chance and the Probability Scale
- Probability with dice
- Probability with spinner colors
- Probability with playing cards
- Probability with crayon colors
- Probability: mixed problems
Recommended Use
- You may choose to present these presentations in any order except for presentation 1 and 6 which need to be presented first and last.
- All 125 slides feature animations.
- Not just visual learners, but all students will benefit from the visual animations that make abstract and complex content more concrete.
- As a teacher, you will find that there is no preparation needed to teach this often difficult-to-understand math topic; simply play the slides for students to take notes on their note-taking sheets. All answers to practice examples are on the slides themselves.
2. Guided Notes - Cornell Style Note-taking Sheets
- The 32 note-taking sheets are to be used in conjunction with the 125 PowerPoint presentation slides.
- The layout of the note-style sheets is similar to Cornell-style notes. The left side features terminology and points to remember while the right side provides scaffolded notes on the lesson and practice examples.
- Pick a presentation topic and play each slide one at a time giving enough time for students to record the missing information. They will be writing down information and solving practice examples from the PowerPoint presentation written in red text.
- Students will be very engaged as they are not just watching you present the slides but in addition, they are actively documenting information.
Also Included
- Teacher-guided notes to use as reference with the presentation.
Targeted Group
This unit caters to differentiation and best targets students in grades 4-8.
Follow-Up Activities
You may follow up the PowerPoint slide presentation with:
The content in the PowerPoint presentations introduces students to the topic and nature of questions featured in the worksheets and task cards. This way students are familiar with the task in order to work independently.
The presentation can also be successfully done solely with the note-taking sheets.
Also Included In
Related Resources
- Graphs Mega Bundle
- Budgeting Plans and Graphing
- Fractions Bundle
- Subitizing Number Sense Building
- Place Value Bundle
- Mental Multiplication Strategies
Thank you for visiting Teach2Tell. New resources are 50% off - do follow the store to get notified :)
Please contact me with any queries regarding this resource.
Thank you!
Laurane@teach2tell.com


