484 results
Adult education graphing activities
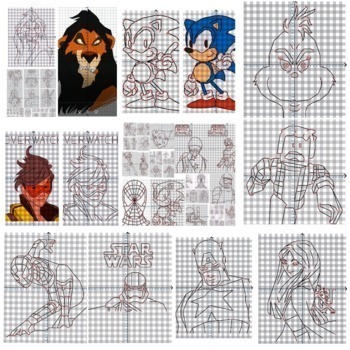
Coordinate Plane Graphing Mystery Pictures, No PREP Science Sub Plans, Math
Click on italic link below to see more images:CoordinatePicturesImages Heather C.Rated 5 out of 5Extremely satisfied"I'm in love with this resource! I love all the different characters especially Scar! My students were engaged and can now plot points correctly."Favorite math activity for students! Teachers have commented how students love this activity! Even teachers love doing them! :) This activity will SAVE YOU over 150 plus hours of class work! Education related and even use it for sub plans
Grades:
6th - 12th, Higher Education, Adult Education
Types:
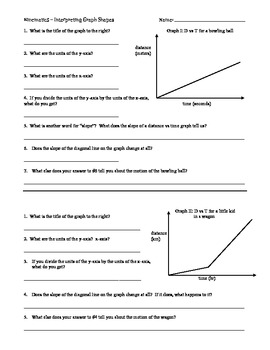
Graphing - Interpreting Distance vs Time Graphs
This worksheet gives students 4 distance vs time graphs and a series of questions about each to lead them through reading graphs. The main goal is to hammer home the point that slope = velocity.This is the second in my set of worksheets on graphing that will lead students through the basics of constructing graphs, interpreting the meaning of graphs, and calculating quantities from graphs.This is ideal for physical science classes where the students are in pre-algebra or algebra 1.
Subjects:
Grades:
7th - 9th, Adult Education
Types:
Also included in: Graphing Bundle
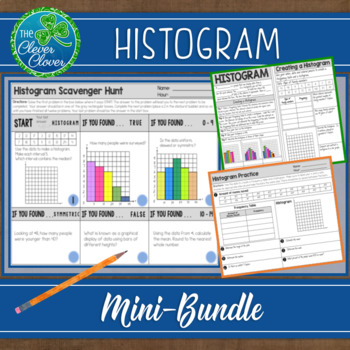
Histogram - Notes, Practice Worksheets and Scavenger Hunt
This histogram resource includes guided notes, a practice worksheet and a scavenger hunt. Your students will have the opportunity to create, interpret and discuss histograms. Below, you will find a detailed description of the notes, worksheet and scavenger hunt. Guided NotesThere are two small pages of guided notes. The first page provides the definition of a histogram and step by step instructions on how to create a histogram. The bottom portion of the notes has students examine three types (un
Subjects:
Grades:
6th - 9th, Adult Education
CCSS:
Also included in: Statistics Bundle - Guided Notes, Worksheets & Scavenger Hunts!
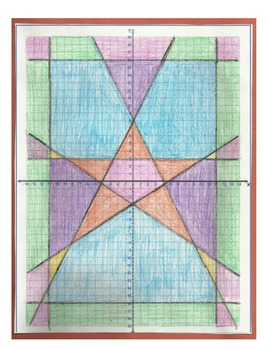
Graphing Linear Equations Quilt Project
Graphing Linear Equations Quilt ProjectI have created this project as a fun way to get my kids excited about graphing lines. I have always found that including art and coloring with math gets kids a bit more excited about learning and as an added bonus- they look great as classroom decorations when finished! These quilts focus on accuracy when graphing diagonal lines along with vertical and horizontal lines.This is a 100 point project that includes: directions for the students, a sheet for the s
Grades:
8th - 11th, Adult Education
Types:
Line of Best Fit/Trend Line/Scatter plot Notes & Practice (facebook)
This is scatter plot activity that has notes on line of best fit/trend line. Students are encouraged to create scatter plots from data from baseball games, as well as amount spent on facebook vs. time doing homework. This is a great real-life activity! It is very fun and engaging. After each scatter plot, questions are asked to determine knowledge from interpreting the scatter plots, as well as the line of best fit! Answer key is included.
Grades:
6th - 10th, Adult Education
Types:
Box and Whisker Plot Activity Bundle
This 21 page mini-lesson/bundle has 3 engaging assignments. Students are expected to find measures of central tendency, while creating and interpreting box and whisker plots. The activities are:
A group project where students use foldable strips to find their own minimum, maximum, and median, and then plot their own box and whisker plots.
They will also take data from local restaurants, find the central tendencies of the data and create box and whisker plots.
Lastly, students are expected t
Grades:
6th - 9th, Adult Education
Types:
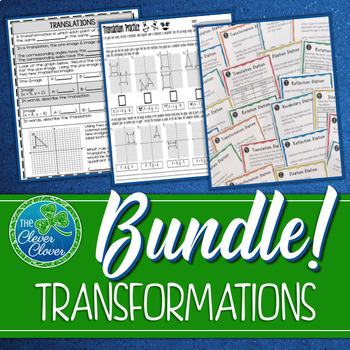
Transformations (Translations, Dilations, Rotations and Reflections) Bundle
The bundle will help you immensely with 8th grade transformations. Students will learn and explore translations, dilations, rotations and reflections. Included you will find interactive notes, worksheets, stations, a sorting activity and assessments. Below, you will find a detailed description of everything included in this bundle.Interactive Notes (4 pages & Answer Keys)This product involves four pages of interactive notes on translations, dilations, rotations and reflections. Each note
Grades:
7th - 9th, Adult Education
CCSS:
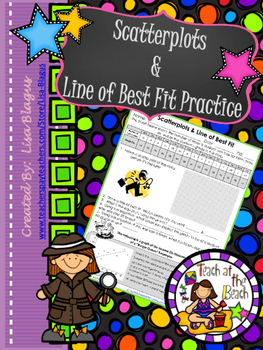
Scatter Plot & Line of Best Fit/Trend Line Mini-Practice
This is a mini lesson on scatter plots. It starts with a giving the students a table and having them graph the data onto a scatter plot. They then find the trend line or the line of best fit and have to answer questions. This is a wonderful homework assignment with not too many questions. It also could serve as a station or in-class assignment.
Grades:
7th - 10th, Adult Education
Types:
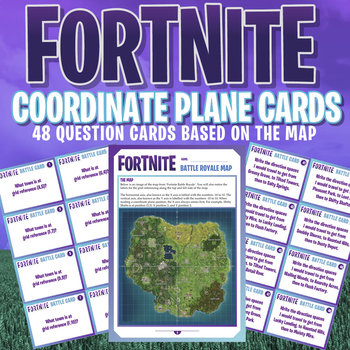
FORTNITE - MATHS - COORDINATE PLANE ACTIVITY CARDS - 48 Question Cards!
SEE OUR EXCITING NEW FORTNITE WORD PUZZLES HERE!HIGH INTEREST - HIGH ENGAGEMENTAn incredible set of 48 question cards, based on the wonderful Fortnite Battle Royale map. Map sheet included!Questions range from the basic naming place at certain coordinate plane reference, right through to the higher level, label the coordinate references of path taken along a designated journey!Great fun for the entire class, and for students of all levels!Check out also the HIGH RESOLUTION MAP PACK available fro
Subjects:
Grades:
4th - 10th, Higher Education, Adult Education, Staff
Types:
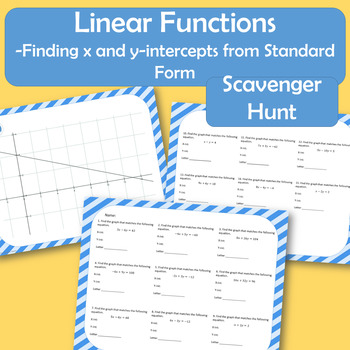
Standard Form of Linear Functions - X and Y Intercept Scavenger Hunt (Set of 15)
This 15 poster scavenger hunt requires students to examine the characteristics of linear function graphs. Have students analyze a question and find the graph that matches the information.Students will: Determine the x and y-intercepts for a linear equation written in standard form. After finding the information, students will find the graph that matches their intercepts. Students will write down the correct letter on their answer sheet.Extension idea - Have students rewrite the equation in
Grades:
5th - 9th, Adult Education
Types:
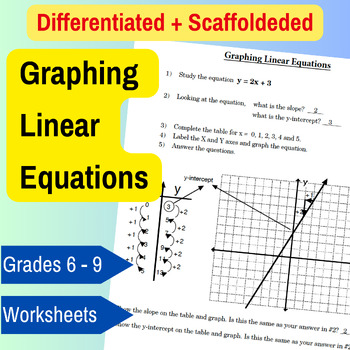
Scaffolded Activities: Exploring Graphing Linear Equations Through Patterns
Looking to engage your students with activities that help them grasp the concepts of linear equations, slope, and y-intercept? This introductory, scaffolded resource is precisely designed for that purpose. It employs patterns to introduce these fundamental concepts, demonstrating how growth slope, y-intercept, t-tables, and graphing linear equations interconnect. Prep is quick and easy! The 14-page lesson plan guides you on introducing each concept using guiding questions to introduce key patter
Subjects:
Grades:
6th - 9th, Adult Education
CCSS:
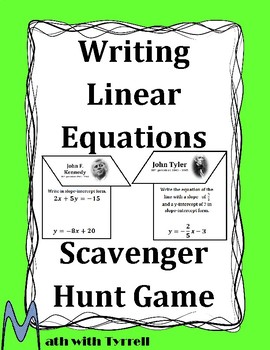
Writing Linear Equations Scavenger Hunt Game
This is a great activity to review writing linear equations at the beginning of the year or at the end of a unit. The Writing Linear Equations Scavenger Hunt Game gets students up and moving around while practicing math. In this game, students use the answer to one problem to find another problem hanging around the classroom. Students will complete a total of 16 problems to create a list of presidents. This product is self-checking and allows a teacher to work one-on-one with students while the
Grades:
9th - 11th, Higher Education, Adult Education
Types:
CCSS:
Also included in: Algebra 1 Scavenger Hunt Bundle
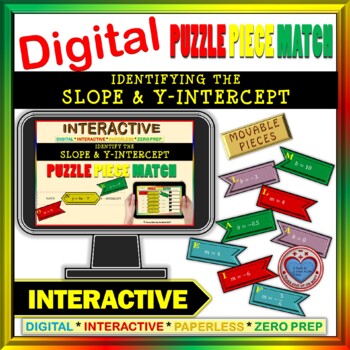
Identify the slope and y-intercept - Google: Puzzle Match Distance Learning
»»-------------¤-------------««»»-------------¤-------------««Have you seen the video of this type of activity??? check out the preview»»-------------¤-------------««»»-------------¤-------------««This Puzzle Match Activity is part of:☑ 2017 Google Interactive Membership {GROWING BUNDLE} - Current & Future ProductsThis ❤ Google Interactive Activity ❤ is an engaging practice of "Identifying the Slope and Y-Intercept" from a given equation. GOAL of this ActivityStudents are given a total o
Grades:
9th - 12th, Higher Education, Adult Education
Types:
Also included in: Google Drive BUNDLE: SLOPE & LINEAR FUNCTIONS Distance Learning
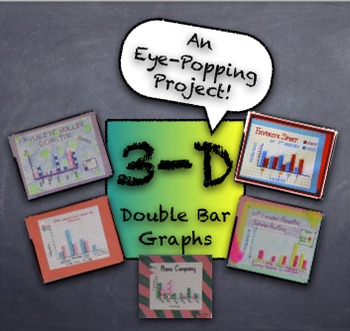
3-D Double Bar Graphs PROJECT from Student Generated Survey Data - Fun Project
This project creates quite an impressive product with simple supplies easily accessible in any classroom. Students generate data from surveys given to peers, using simple questions like, "What's your favorite pizza topping?" Students use survey results to create a 3-dimensional "girls versus boys" double-bar graph. Using centimeter graph paper, markers, and glue sticks, the double-bar graph projects are truly eye-popping! Project description, survey information, and graph assembly instructio
Subjects:
Grades:
3rd - 12th, Adult Education
Types:
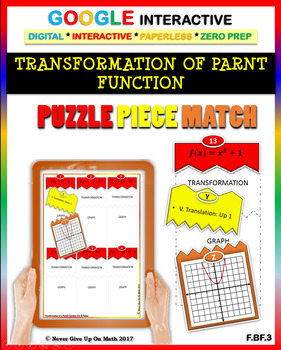
Transformation of Functions (2 Levels) - Google: Puzzle Match Distance Learning
Transformation of Parent Function (2 Levels) - Google Interactive: Puzzle Match»»-------------¤-------------««»»-------------¤-------------««Have you seen the video of this type of activity??? check out the preview»»-------------¤-------------««»»-------------¤-------------««This Puzzle Match is part of:☑ 2017 Google Interactive Membership {GROWING BUNDLE} - Current & Future ProductsThis ❤ Google Interactive Activity ❤ is an engaging practice of "Transformation of Parent Function" . GOAL
Grades:
9th - 12th, Higher Education, Adult Education
Types:
Also included in: DISTANCE LEARNING: ALGEBRA II TOP 20 INTERACTIVE ACTIVITIES
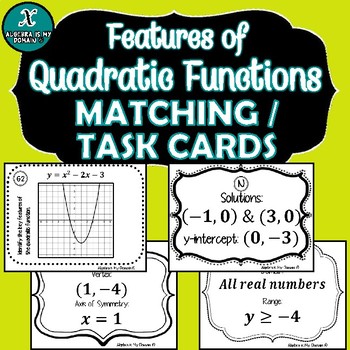
TASK CARDS / MATCHING ACTIVITY - Algebra - Parabolas & Quadratic Functions
Set of 64 total task cards / matching cards. These cards have been designed to be used to review a unit on quadratic functions.There are sixteen (16) task cards with a quadratic function and its graph. Students will then identify the vertex, axis of symmetry, the solutions (roots), y-int, domain, and range.This file includes:(16) cards with an quadratic function and graph(16) cards with the vertex and axis of symmetry(16) cards with the solutions (roots) and the y-intercept(16) cards with the
Grades:
7th - 11th, Higher Education, Adult Education
Types:
CCSS:
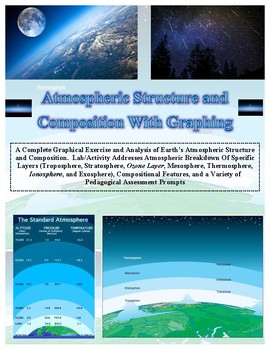
Atmospheric Layers Structure and Graphing LAB (An Earth Science Favorite!)
PROCEEDS BENEFIT "REACH INC."-EMPOWERING ADULTS WITH DISABILITIES
http://www.reachinc.org
Great COMBINATION of both math and science! This is an updated version by Southern Science Specialists.
New content, assessment prompts, and graphical template.
---------------------------------------------------------------------------------------------------------
See the "Extended Version" that additionally addresses the atmospheres of other planets found at the link below
CLICK HERE FOR EXTENDED VER
Subjects:
Grades:
5th - 10th, Adult Education
Types:
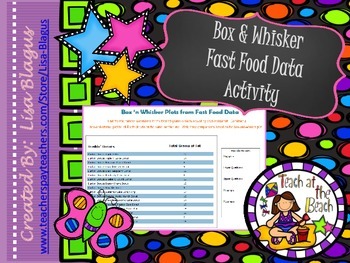
Box 'n Whisker Data for Local Fast Food Restaurants
This activity brings a real-life activity into the classroom. Students look at 4 popular fast food restaurants (Arbys, KFC, Dunkin Donuts, and Pizza Hut)and find the median, maximum, minimun, lower quartile, and upper quartile from their grams of fat. After looking at each of them, students are asked to answer questions pertaining to the box and whisker graphs they've drawn from the data. A fun way to construct graphs and look at data!!!
Looking for a few more resources? This product is par
Subjects:
Grades:
6th - 11th, Adult Education
Types:
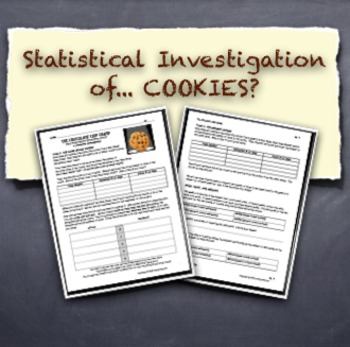
Statistical Investigation Graphing and Analyzing COOKIE Data!
Does name brand mean more chocolate chips? That is the question that fuels this entire statistical investigation! Students gather chip data from actual cookies, analyzing and graphing it along the way. By the end of the investigation, students will have explored mean, median, mode, range, back-to-back stem-and-leaf plots, double bar graphs, box-and-whisker plots, and the idea of estimating. All cookies involved will be destroyed... but it's all worth it!
Subjects:
Grades:
4th - 9th, Adult Education
Types:
Task Cards Reading Graphs: Line Graphs, Bar Graphs, and Pie Chart: Revised
40 Task Cards. Teach your students how to read and interpret a line graph, bar graph, or pie chart from a word problem or given data. Challenge your students to think more critically and become better mathematicians. Start your students on their
way to becoming better problem graphic interpreters.
A teachers guide entitled “Learn to Read Graphs” is included. An answer guide for each activity is also provided.
Some common core standards met by this activity will be:
CCSS.Math.
Subjects:
Grades:
3rd - 9th, Adult Education
Types:

Excel Spreadsheets Million Dollars Activity
This resource allows students to understand the following: How graphs change when spreadsheet data is alteredUse of SUM() functionsHow graphs are madeComponents of a graphAdvantages of spreadsheets over pen and paper methodsStudents use this resource to understand how altering data in spreadsheets allow graphs to change. They understand such concepts by trying to spend a Million Dollars in a minute. Students are then expected to complete the associated worksheet which accompanies the spreadsheet
Grades:
5th - 12th, Adult Education
Types:
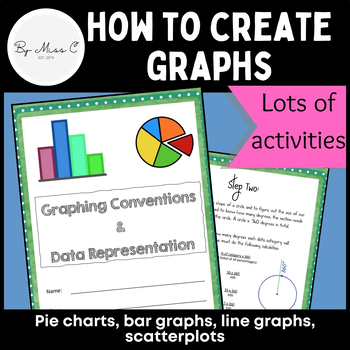
Guide to graphs: Pie charts, bar graphs, line graphs, scatterplots + activities
This is a fantastic resource for introducing students to graphing and data representation. This booklet will take students through the uses for particular graphs and how to construct them. At the end of each module, there are activities for students to complete, to practice their graphing skills. Answer key is included, making this a no-prep activity. This booklet covers: - why we visually represent data- pie charts and how to create them - bar graphs and how to create them - line graphs and how
Subjects:
Grades:
6th - 12th, Higher Education, Adult Education
Types:
CCSS:
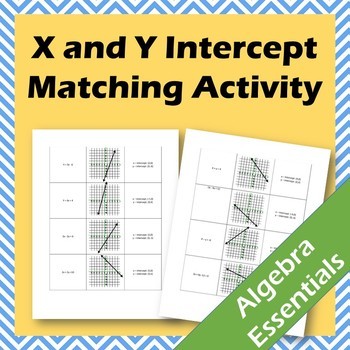
X- and Y-Intercept Matching Activity (CCSS.HSF.IF.B.4)
This matching activity is designed to be practice for students in finding the x- and y-intercepts of a graph and from an equation. Students will have to use critical thinking skills in order to match the three sets. Finding intercepts is a difficult task for students to attain. This practice will help students see the relation between an ordered pair, equation of a line and a graphed line.
You may also like:
X and Y-intercepts Scavenger Hunt
Linear Modeling Projects!
Modeling Activity
Piecew
Grades:
6th - 12th, Higher Education, Adult Education
Types:
Also included in: X & Y Intercept Matching and Scavenger Hunt Bundle (CCSS.HSF.IF.B.4)
Interpreting Graphs for the Middle & Junior High School: Book 2
Here is another set of data graphics for your students to analyze and interpret. Using survey results from the USA Today newspaper, students will be asked to explain what the graphics are illustrating. Each activity will ask the student to identify basic information presented in each graphic and make some projections based on the data given in the survey.
The activities in this packet are a great way to improve your student’s skills in taking apart graphic displays of information. Brin
Subjects:
Grades:
4th - 10th, Adult Education
Types:
Showing 1-24 of 484 results


