Histogram - Notes, Practice Worksheets and Scavenger Hunt
- PDF
What educators are saying
Also included in
- Are your kids studying the measures of central tendency, box and whisker plots, stem and leaf plots, two-way tables, histograms and scatter plots? This valuable resource includes guided notes, worksheets, scavenger hunts, assessments and more that you can use for your statistics unit. Below you willPrice $20.80Original Price $26.00Save $5.20
Description
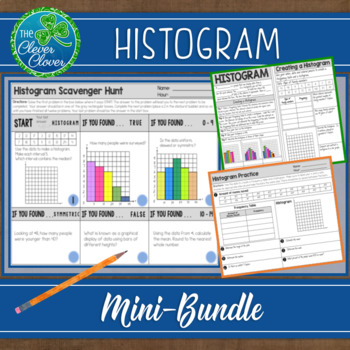
This histogram resource includes guided notes, a practice worksheet and a scavenger hunt. Your students will have the opportunity to create, interpret and discuss histograms. Below, you will find a detailed description of the notes, worksheet and scavenger hunt.
Guided Notes
There are two small pages of guided notes. The first page provides the definition of a histogram and step by step instructions on how to create a histogram. The bottom portion of the notes has students examine three types (uniform, symmetric, and skewed) of data distribution that could exist on a histogram.
Practice Worksheet
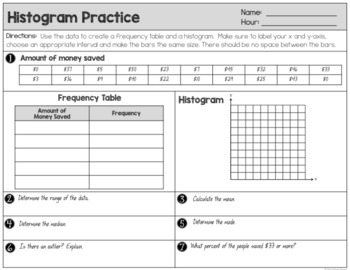
The two page practice worksheet requires students to create two histograms from data sets. Students are provided space to make a frequency table. A variety of questions are given for each histogram. Students will identify and calculate the range, measures of central tendency and outliers. They will also be asked where they might see histograms and the purpose of histograms.
Scavenger Hunt
A histogram scavenger hunt will navigate students through twelve thought provoking questions. Students will explore and answer questions about measures of central tendency, the size of a data set and the appearance of the data distribution. One question requires students to make a histogram using sixteen numbers. At the end of the scavenger hunt, there are two open ended questions for students to answer and explain their thinking.
Detailed answer keys are provided.
Leaving feedback will earn you credits for future TPT resources. Follow me to receive discounts for the first 24 hours on new resources.
Please contact me if you have any questions. The Clever Clover
Connect with me on social media!


