22 results
Adult education graphing laboratories
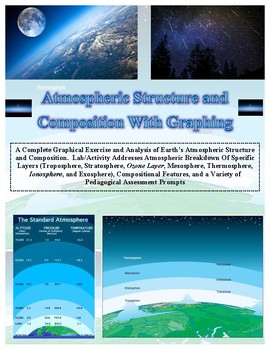
Atmospheric Layers Structure and Graphing LAB (An Earth Science Favorite!)
PROCEEDS BENEFIT "REACH INC."-EMPOWERING ADULTS WITH DISABILITIES
http://www.reachinc.org
Great COMBINATION of both math and science! This is an updated version by Southern Science Specialists.
New content, assessment prompts, and graphical template.
---------------------------------------------------------------------------------------------------------
See the "Extended Version" that additionally addresses the atmospheres of other planets found at the link below
CLICK HERE FOR EXTENDED VER
Subjects:
Grades:
5th - 10th, Adult Education
Types:
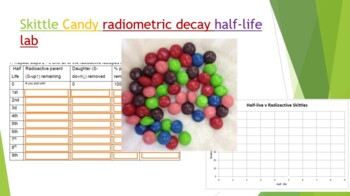
Skittle Radiometric Decay Half-life Lab
Did you know you can use Skittles candy to demonstrate absolute dating and radiometric decay! Buy a 1-4 lb bag at your local bulk warehouse store for savings. This lab is a great way to show how isotopes decay by shaking a plate full of random skittles. Students use Skittles to observe "Isotopes" decay over each half life. At the end of the lab (and only IF they have done all their work) they can enjoy their "daughter products". Skittles were used because they are durable, hypoallergenic, and th
Subjects:
Grades:
8th - 12th, Higher Education, Adult Education
Types:
NGSS:
HS-PS1-8
, HS-PS1-1
, HS-PS1-4
, HS-PS1-6
, MS-PS1-4
...
Also included in: Hands-on Science Semester Labs Bundle
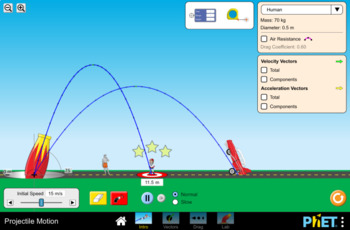
Projectile Motion Simulation Lab- PhET
This handout is meant to accompany the Projectile Motion simulation found here: https://phet.colorado.edu/en/simulation/projectile-motion
45 minute lesson time
This lab can be used to teach a range of concepts such as:
-Relationships between independent/manipulated and dependent/responding variables
-Forces in motion
-Projectile Motion
-The relationship between firing angle and distance traveled
-Graphing independent/ dependent variables
-Creating data tables
Subjects:
Grades:
6th - 12th, Higher Education, Adult Education
Types:

Webquest Investigation - Slope of a Line
Using a free online graphing calculator, students explore relationships between linear equations, their graphs, and the slopes of the lines. By the end of this investigation, students will discover relationships between parallel lines, perpendicular lines, and their slopes. Enjoy!
Subjects:
Grades:
7th - 11th, Adult Education
Types:
Quadratic Function Activity About Your Dental Arch
Through this activity students will discover properties of parabolas while comparing the parabola they all carry around with them every day - their dental arch. Students will brainstorm ways to measure a dental arch and ultimately take an "impression" of their arch by taking a bite out of a slice of bread. Then they will trace their arch onto a graph, use the graph to generate a table of values, and then use the table to plug into an equation for the most "perfect" dental arch. Students love
Subjects:
Grades:
8th - 12th, Higher Education, Adult Education
Types:
Also included in: Quadratic Functions Activities Bundle

MS-PS1-6 Exothermic Chemistry: Dissolving Calcium Chloride
This is a rigorous and exciting laboratory experience directly aligned to Next Generation Science Standard MS-PS1-6. In this lab, students will discover and demonstrate an exothermic chemical process. They will collect and analyze data to determine whether energy was absorbed or released, what is happening to the molecules of the solution, and more! My students loved it, and assessment data shows it is very effective! Included with purchase: → Lab report, and guide that follows the Scientific Me
Subjects:
Grades:
6th - 12th, Adult Education
Types:
NGSS:
MS-PS1-6
Micro:bit Accelerometer Funcamentals
This lesson demonstrates how to use and gather information from the Micro:bit accelerometer. Use this lesson to reference lessons in science and math.The accelerometer measures motion and acceleration. Use this information to reference concepts learned in science on mass, motion, acceleration, and velocity. Use the sensor to measure motion, acceleration, and velocity.The accelerometer measures acceleration along the x, y, and z planes. Use this information to reference the coordinate plane used
Subjects:
Grades:
3rd - 12th, Higher Education, Adult Education, Staff
Types:
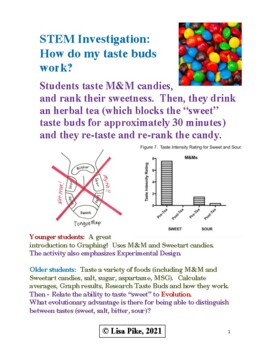
The NEW Taste Test - Blocks Taste Receptors, Students Learn Graphing/Analysis
Focus Question:How do we perceive flavor?How do our taste buds work?Conceptual Understanding: Plants and animals have physical characteristics that allow them to receive information from the environment. Structural adaptations within groups of plants and animals allow them to better survive and reproduce. This is NOT your old fashioned Tongue map (debunked) - but an actual experiment where taste receptors are blocked temporarily. Students learn about taste, and older students learn about tast
Subjects:
Grades:
3rd - 12th, Higher Education, Adult Education
Types:
NGSS:
4-LS1-1
, MS-LS1-3
, MS-LS1-1
, HS-LS4-2
, MS-LS1-4
...

Endothermic Lab: Dissolving Ammonium Chloride NGSS MS-PS1-6
This is a rigorous and exciting laboratory experience directly aligned to Next Generation Science Standard MS-PS1-6. In this lab, students will discover and demonstrate an endothermic chemical process. They will collect and analyze data to determine whether energy was absorbed or released, what is happening to the molecules of the solution, and more! Included with purchase: → Lab report, and guide that follows the Scientific Method→ 3 possible Learning Targets→ 8 rigorous analysis questions → Pr
Subjects:
Grades:
6th - 12th, Adult Education
Types:
NGSS:
MS-PS1-6
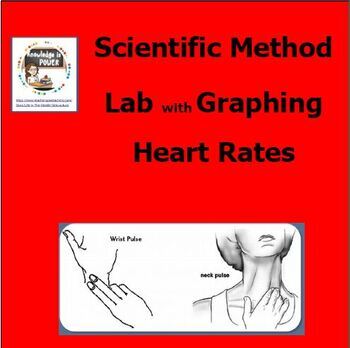
Scientific Method Heart Rate Lab with Graphing
This Scientific Method Heart Rate Lab with Graphing teaches students the concepts of independent and dependent variables, the dynamics of lab group data collection and lab reports and gives them graphing practice. This lab is to broken down into 2 parts over 3 days. This lab is to broken down into 2 parts over 3 days. Day/Part 1:Data collectionIn this lab, students work in groups of 3-4 students to measure, compare and graph their resting, walking and running (in place) heart rates. Create an c
Grades:
6th - 12th, Adult Education
Types:
Also included in: Scientific Method Resources Bundle
LET THE BALL BOUNCE Scientific Method LAB with graphing 2-3 days
This Let the Ball Bounce Scientific Method Lab with Graphing teaches students the concepts of independent and dependent variables, the dynamics of lab group data collection and lab reports and gives them graphing practice. This lab is to broken down into 2 parts over 2 days. Each student is independently responsible for recording data and completing the lab report and graph. Day1 / Part 1: Pass out only first two pages if lab worksheet, stapled.Data collection: Inform students that the 9 tenni
Subjects:
Grades:
7th - 12th, Adult Education
Types:
Also included in: Scientific Method Resources Bundle
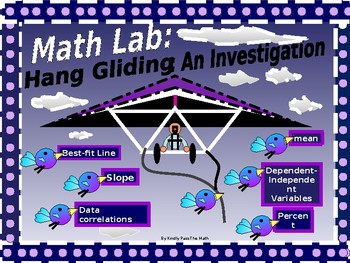
Math Lab An Algebra Review Via Hands-on Glider Investigation
Please join me in my enthusiasm for Math Lab Investigating Gliders!The lab is a two day event that covers and reviews multiple concepts covered in Algebra I, semesters I and II* It is outstanding for bringing concepts back to students prior to finals and for assisting them in applying mathematics to real life situations.* This 50 page investigation requires the student to address the relationship between the wing-span of a glider and the distance that it can fly.* On day one, students work in
Subjects:
Grades:
7th - 12th, Higher Education, Adult Education
Types:
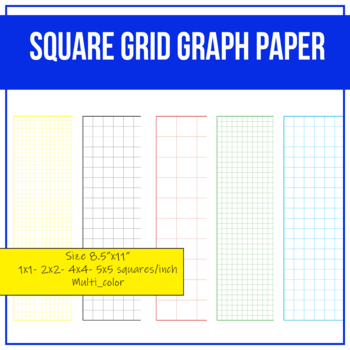
Square Grid Graph Paper / Multi-color Size 8.5 x 11 in
These blank grid graph paper will be great for elementary math, geometry, calculus, trigonometry, physics, engineering, drawings, drafting, planning, arts, making graphs, puzzles, homework assignment or even for quick notesThey are 8.5 x 11 in (letter size). Files are provided in .png with transparent background, jpg white background and pdf. All with black & white, blue, red, green, and yellow color.All images or pictures are high resolution so you can have large illustrations of them and t
Subjects:
Grades:
PreK - 12th, Higher Education, Adult Education, Staff
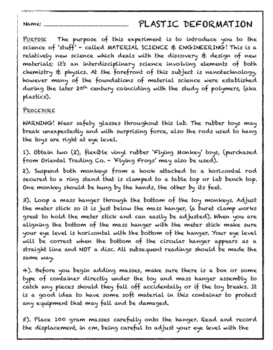
FLYING MONKEYS AND PLASTIC DEFORMATION
The purpose of this experiment is to introduce your students to the science of ‘stuff’ - called MATERIAL SCIENCE & ENGINEERING! This is a relatively new science which deals with the discovery & design of new materials; it’s an interdisciplinary science involving elements of both chemistry & physics. At the forefront of this subject is nanotechnology, however many of the foundations of material science were established during the later 20th century coinciding with the study of polymer
Subjects:
Grades:
7th - 12th, Higher Education, Adult Education
Types:
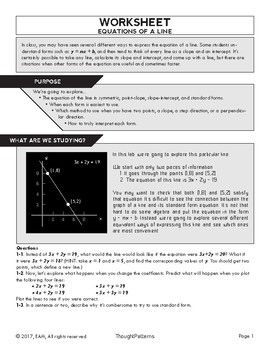
Lab - Equations of a Line
This is an assignment I created to give students a little bit of practice with equations of lines, instead of just repeating the mantra "y equals mx plus b" by rote. This lab is also available as part of my unit package, if you would like to purchase the teachers' notes as well.
Subjects:
Grades:
9th - 12th, Adult Education
Types:
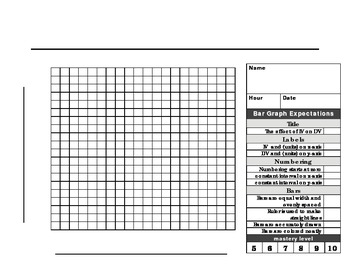
Bar Graph paper and rubric
This 20 X 20 graph paper with rubric is made for a beginner scientist to make a the perfect BAR graph. The checklist format makes it easy for students to know what is expected when graphing. Enjoy!
Subjects:
Grades:
1st - 12th, Higher Education, Adult Education
Types:
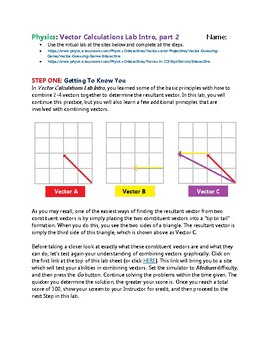
Physics: Vector Calculations Lab-Introduction, part 2
Would you like some assistance in teaching vectors to your Physics or Math classes? This lab might be just what you are looking for. Elegantly illustrated and clearly written in a step-by-step manner, this lab walks the students through the key introductory principles involving vector calculations. Picking up where Physics: Vector Calculations Lab-Introduction left off, this lab explores a few more of the finer details of combining vectors. Combining vectors can be a challenging task, but this s
Grades:
7th - 12th, Higher Education, Adult Education
NGSS:
MS-ETS1-4
, MS-ETS1-3
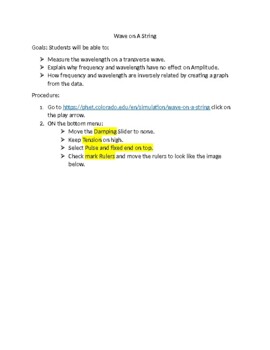
Wave on a String Virtual PHET Lab
Goals: Students will be able to:Ø Measure the wavelength on a transverse wave.Ø Explain why frequency and wavelength have no effect on Amplitude.Ø How frequency and wavelength are inversely related by creating a graph from the data.
Subjects:
Grades:
7th - 11th, Adult Education
Types:
NGSS:
MS-PS4-1
, HS-PS4-1
Also included in: Physical Science Virtual Lab Bundle
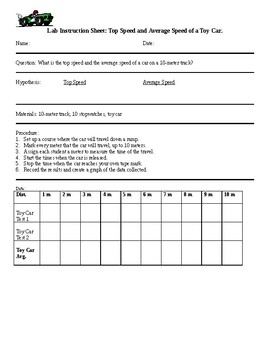
Lab; The Top Speed and the Average Speed of an RC Car
This lab uses simple math, a meter stick with tape track, and differentiation to get all the kids involved in the lab.This could be completed inside in a hallway or a basement.
Subjects:
Grades:
6th - 12th, Higher Education, Adult Education, Staff
Types:
Also included in: Physics Labs
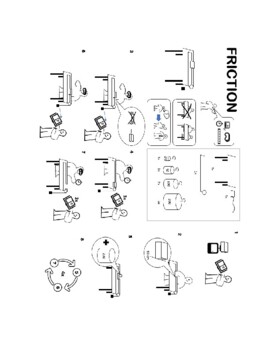
Friction Dynamics Lab - Calculating Coefficient of Friction
In this lab, students calculate the normal force and friction force using a wooden block on a wooden ramp. The resulting data is then graphed to determine the coefficient of friction for the two surfaces in contact.
Grades:
11th - 12th, Higher Education, Adult Education
Types:
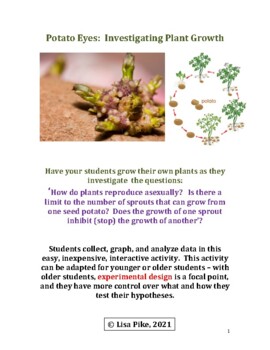
Plant Potato Eyes
In this lab we will investigate potato growth: do they regulate their sprout growth? Can every potato eye sprout, or is there a limit to the number of sprouts that can grow from one seed potato? Does the growth of one sprout inhibit (stop) the growth of another?
Subjects:
Grades:
4th - 12th, Adult Education
Types:
NGSS:
4-LS1-1
, MS-LS1-1
, HS-LS1-2
, MS-LS1-4
, HS-LS1-3
Grid-lined graph paper
Here are 5 benefits of using grid-lined graph paper:1. Accurate measurements and alignment for technical drawings and designs.2. Efficient organization and analysis of data.3. Enhanced geometry and math exercises.4. Detailed and precise artistic drawings and sketching.5. Practical for various crafting and DIY projects. Grid-lined graph paper is a versatile tool that helps with precision, organization, creativity, and problem-solving in a wide range of fields.
Subjects:
Grades:
1st - 12th, Adult Education
Types:
Showing 1-22 of 22 results


