660 results
Not grade specific graphing activities
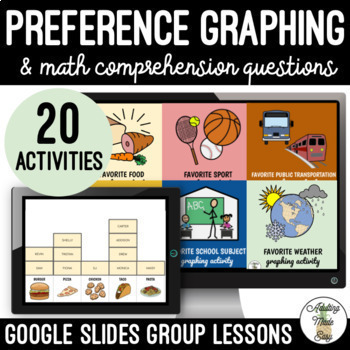
Preference Graphing Google Slides Group Lessons SS
Fun visual digital activity to do with students at the beginning of the year or on Fun Fridays! Combine getting to know students with some graphing comprehension, counting and math skills!| Back to School BTS | Life Skills | Graph | Get to know you | all about me | Ice Breaker | Remote Learning | Distance LearningThis Comes With:18 Google Slides™ Activities (can easily be converted to Power Point)On the first slide, take turns asking students and staff their preferences given the choicesType th
Subjects:
Grades:
Not Grade Specific
Types:
Also included in: First Week of School Secondary Special Education BUNDLE
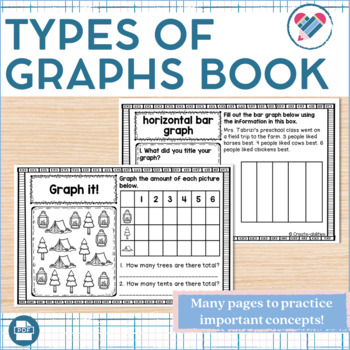
Different Types of Graphs Book
This 26 page pack gives your students many different opportunities to learn about and identify different types of graphs. They will also create and draw their own graphs. The book is half page to help with printing, copying, and stapling. The size also helps students be able to store them inside their desks or folders for easy access to this information. Teaching this important measurement concept has never been easier or more fun!Many Different Types of Charts and Graphs to Deepen Your Student'
Subjects:
Grades:
Not Grade Specific
Types:
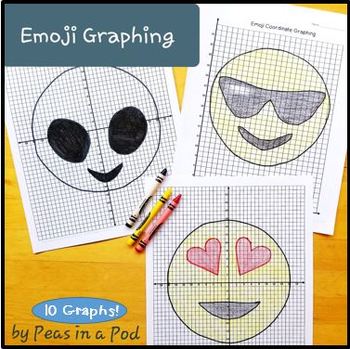
Last Day of School Coordinate Graph 1 and 4 Quadrant Graphing Mystery Pictures
Emoji Coordinate Graphing Activity - Make math FUN with these engaging coordinate graphing activities featuring emojis! 1 AND 4 quadrant graphing mystery pictures designed for early finishers, or as extra credit assignments, this resource offers a variety of coordinate graphing puzzles that are sure to captivate students' interest. ✅ What's included: ✅5 Emoji Coordinate Graphing Puzzles:Features five different emojis for students to graph on coordinate planes.Blank Coordinate Graphing Paper:Prov
Subjects:
Grades:
Not Grade Specific
Also included in: Main Idea 6th Grade | Text Structures 6th Grade Opinion Writing +
BACK TO SCHOOL STEM ACTIVITY: Paper Airplane Challenge
Use the basic STEM principles when designing your own paper airplane. You could add to this activity by researching the four factors of flight and tried and true paper airplane designs before you begin. Then, have a class competition! I put my students in groups of 2-3. They come up with a group name. After they have developed their "winning" design, we go to an open space in the school and launch the competition. You will be surprised how many school personnel will come out of the woodwo
Subjects:
Grades:
Not Grade Specific
Types:
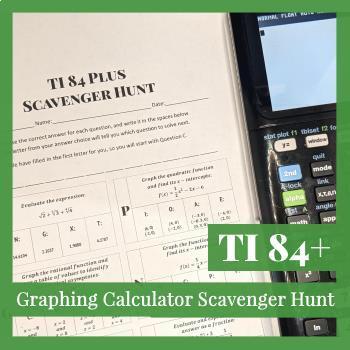
Graphing Calculator Lesson and Activity for the TI-84 Plus
Graphing Calculator Scavenger Hunt for the TI-84+ Start the year off right! With this ready-to-go lesson, you can teach the foundational calculator skills students will need in all of their math classes in just 1-3 days. Topics include:Evaluating ExpressionsRadicals (Square Roots, Cube Roots, etc.)Fractions vs. DecimalsScientific NotationDegrees vs. RadiansGraphing Linear FunctionsGraphing Quadratic FunctionsGraphing Rational FunctionsFinding x-Intercepts/RootsFinding the VertexFinding Vertical
Subjects:
Grades:
Not Grade Specific
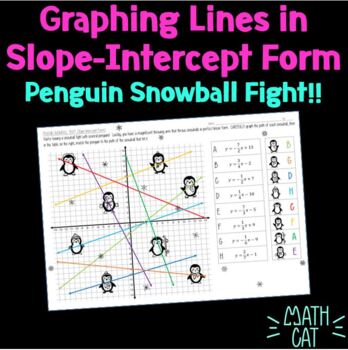
Penguin Snowball Fight! Graphing Lines in Slope-Intercept Form
This fun winter-themed activity requires students to practice NEATLY graphing linear functions in slope-intercept form (y = mx+b). Students will graph 8 lines, and should have an understanding of using the slope and y-intercepts to graph. After students graph each linear function, they write the letter of the function next to the penguin that it went through. This is a fitting activity for winter months, such as December, January, or February, but is also fun to use at any time of the year!Visi
Grades:
Not Grade Specific
Types:
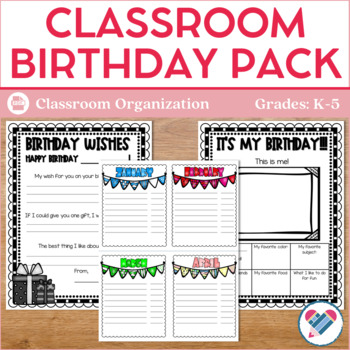
Classroom Birthday Set
Classroom birthdays should be a fun time to celebrate each child individually. This 42 page birthday set makes celebrating in your room easy and fun! You will receive bookmarks, certificates, notes home, bulletin board pieces, and more!Make Every Student Feel Special With Certificates, Bookmarks, Pencil Toppers, and More• birthday bookmarks • birthday cupcake/pencil toppers• birthday certificates (5 different colors, 4 black and white)• birthday girl and birthday boy pages for students to write
Subjects:
Grades:
Not Grade Specific
Also included in: The Ultimate Classroom Organization System
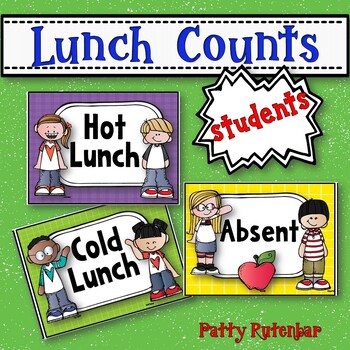
Lunch Count Signs
Are you looking for a way to have your students show their lunch choices? Do you need something that students can independently use? This is just what you need. They are great for classroom management!Print and laminate these signs, attach magnets to them (if you have a magnetic white board), and place in your classroom. Make a tag for each child with their name on it. Everyone starts out in the Absent list each morning. They then move their name to the place that shows whether they are hot or c
Grades:
Not Grade Specific
Types:
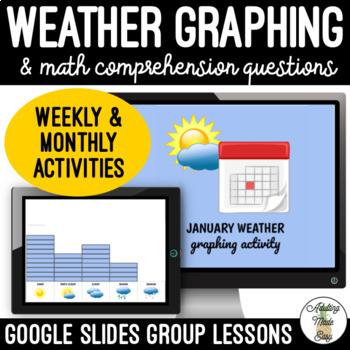
Weather Graphing Google Slides Group Lessons
Fun visual digital activity to do with students every day throughout the whole year! Combine weather & calendar skills with graphing comprehension, counting and math skills!| Back to School BTS | Life Skills | Graph | Daily | weekly | full year | Remote Learning | Distance LearningThis Comes With:13 Google Slides™ Activities (can easily be converted to Power Point)Type today’s date in a square (located on the left side of the slide)After determining the day’s weather, drag and drop the squa
Subjects:
Grades:
Not Grade Specific
Types:
Estimation Jar
Use this engaging activity to practice data and estimation in the classroom all year round. Students estimate the number of items in your jar and at the end of the week analyze the estimation guesses. The student who guesses the closest receives an Estimation Chamption certificate and gets to take home the jar and fill it with a new item.
This pack includes:
Estimation Jar labels
Estimation Jar ideas
Estimation jar slips
Estimation Champion certificates (in color and black and white)
Parent let
Subjects:
Grades:
Not Grade Specific
Types:
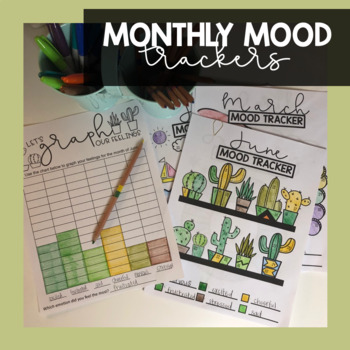
Monthly Mood Trackers
This is a growing product, purchase it now at a lower price!This product includes- 12 monthly mood trackers in two different formats (prefilled emotions and blank)- half page booklet form of both formats (organized in the standard calendar year form and the school calendar year form)- half page booklet form with graphing sheets for each month (standard and school calendar)- Graphing pages in both formats for each month that matches the monthly theme.- Reflection pages to match each monthly theme
Grades:
Not Grade Specific
Types:
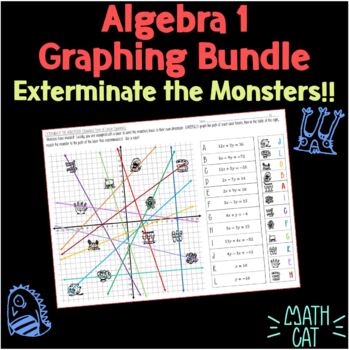
Algebra 1 Fun Monsters Graphing Worksheet Bundle
This bundle includes 9 Exterminate the Monster Graphing Activities!Graphing Lines- Standard FormGraphing Lines- Point-Slope FormGraphing Lines- Slope-Intercept FormGraphing Lines- Mixed FormsGraphing Absolute Value FunctionsGraphing Quadratics- Standard FormGraphing Quadratics- Vertex FormGraphing Quadratics- Factored FormGraphing Quadratics- Mixed FormsGraphing Square Root FunctionsStudents Match the equations to the correct monster by graphing the function and seeing what monster is "extermina
Grades:
Not Grade Specific
Types:
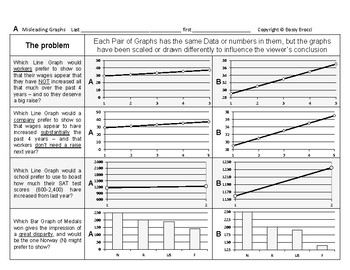
Stats&Data 14: Misleading & Misinterpreting Data Graphs Charts Statistics
This is an excerpt from my popular line ofBossy Brocci Math & Big Science workbooks on Amazon.ANSWER KEY included=======================Students will:1) Analyze 20 different Graphs or Data Displays2) Draw Conclusions & Answer questions about theaccuracy, fairness, limitations & legitimacy of those Graphs3) Answer 16 Multiple-choice questionsbased on their Calculations & Observations4) Be compelled to show their work in a neat & orderly format5) Be trained to methodically &
Subjects:
Grades:
Not Grade Specific
Types:
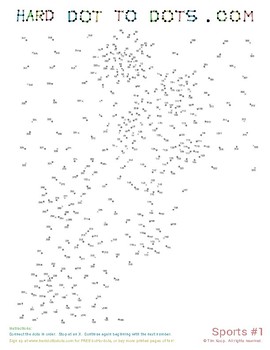
Sports 10 pack Hard Dot to Dots
10 pack of digital Hard Dot to Dots with a Sports theme
Subjects:
Grades:
Not Grade Specific
Types:
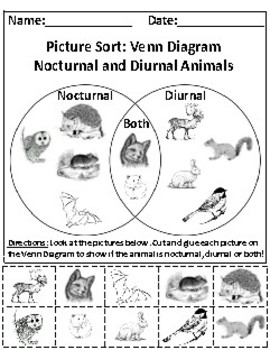
Nocturnal and Diurnal Animals Picture Sort Kindergarten Graph Activity
**********************************************************************************************************Tips ♥ ♥ JarVirtually send a tip in seconds!https://www.buymeacoffee.com/thankyoualotThank you for your tip!Your tip supports me to support you.Tips go tographic art purchases and text font purchases for product creationthe site membership feeandyes, coffee for late hours of product creation! :-)*************************************************************************************************
Subjects:
Grades:
PreK - 1st, Not Grade Specific
Types:
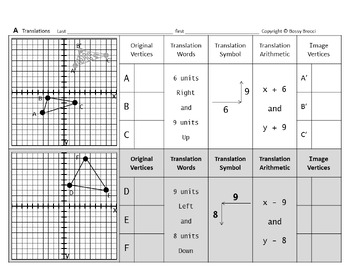
Transformations Slides Bundle E: Translations Reflections Rotations & Dilations
From the Author of Bossy BrocciMath & Big Science workbooks on Amazon,comes student fillable editable interactiveGoogle Slides™ for Google Classroom™ Students can insert/overlay text & graphics[textboxes, shapes, lines, arrows, colors etc.]onto the G-Slide image backgroundorConvert to PDF, then make it interactive onlineby using various third-party Ed. websitesorPrint it for paper worksheets=======================This Transformations MEGA Bundle onTranslations, Reflections, Rotations &a
Grades:
Not Grade Specific
Types:
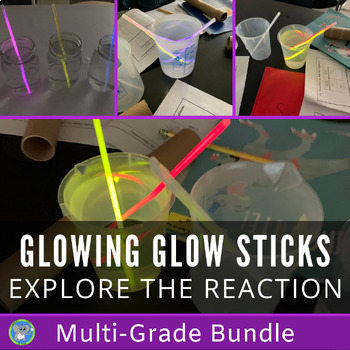
Chemical Reaction Bundle | The Science Of Glow Sticks | Light Activity
Engage students with the science of glow sticks. All grade levels teach the same concept but differentiate by age and abilities. This enables a teacher to teach the same concept at the same time. Great for the science lab teacher and homeschool family. By purchasing this bundle, you are SAVING 20% off each individual resource.Digital and Distance Learning Approved. This experiment uses simple supplies and can work well for a distance learning or digital activity. The teacher can perform the
Subjects:
Grades:
Not Grade Specific
NGSS:
5-PS1-3
, 5-PS1-4
, 2-PS1-4
, 4-PS3-3
, 2-PS1-1
...
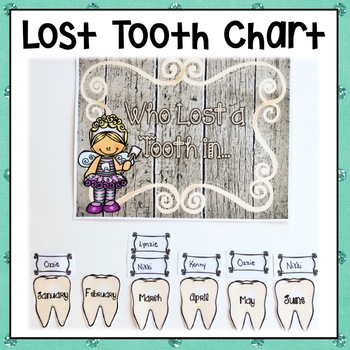
LOST TOOTH GRAPH CHART BULLETIN BOARD DISPLAY
This Lost Tooth Graph is a quick and easy way to celebrate each time your students lose a tooth. With this fun display you will receive:• "Who Lost a Tooth in..." heading• Tooth for each month • Editable frame to display each students' name in. These frames stack very well to create a bar graph that you can use to collect and analyze tooth data during the school year. This set is editable so you be able to type the students' names into each box. Check out the preview for more information!
Grades:
Not Grade Specific
Also included in: WOODLAND ANIMALS THEME CLASSROOM DECOR EDITABLE *HUGE* BUNDLE
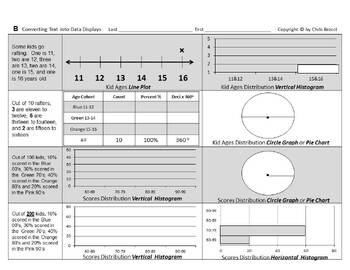
Stats&Data Bundle C: Data Displays Measures of Central Tendency & Variation
From the Author of Bossy BrocciMath & Big Science workbooks on Amazon,this Bundle of Data Displays,Measures of Central Tendency(Mean, Median, Mode & Range);and Measures of Variation(Quartiles, Interquartile Range, Outliers & Box Whisker plots)contains:11 Lessons32 Worksheets832 Problems & Tasks- and Assessment up the a$$=======================Answer KEYS included=======================Coverage Specifics:#1 Identify & Select Common Typesof Data DisplaysStudents will:1) Identi
Subjects:
Grades:
Not Grade Specific
Types:
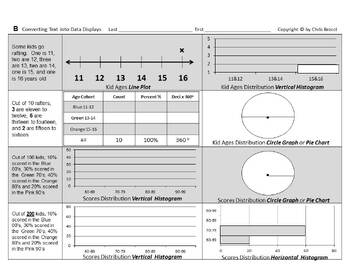
Stats&Data Slides Bundle C: Data Displays Measures of Central Tendency Variation
From the Author of Bossy BrocciMath & Big Science workbooks on Amazon,comes student fillable editable interactiveGoogle Slides™ for Google Classroom™ Students can insert/overlay text & graphics[textboxes, shapes, lines, arrows, colors etc.]onto the G-Slide image backgroundorConvert to PDF, then make it interactive onlineby using various third-party Ed. websitesorPrint it for paper worksheets=======================This Bundle of Data Displays,Measures of Central Tendency(Mean, Median, M
Subjects:
Grades:
Not Grade Specific
Types:
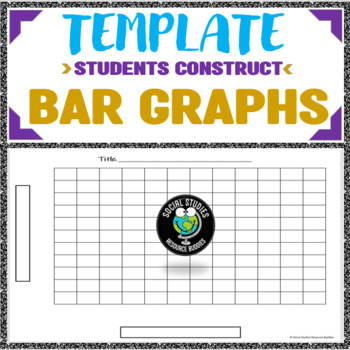
Bar Graph Template FREEBIE
Free! Integrate graph building into your curriculum with this free bar graph template! Includes designated areas for the graph's title and to label the x and y axis. Graph is 11x12.Thanks for your support! For more time-saving resources, check out my store!
Grades:
Not Grade Specific
Types:
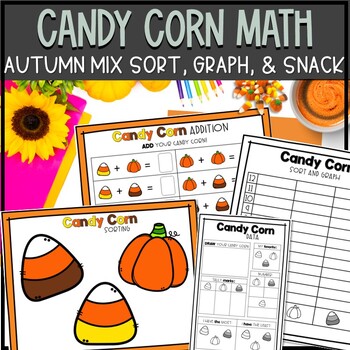
Autumn Mix Candy Corn Sort, Graph, and Snack Activity
Autumn Mix Candy Corn Sort, Graph, and Snack Activity:INCLUDED:•3 graphing pages without numbers - color and B&W•3 graphing pages with numbers - color and B&W•3 graph and data sheets - color and B&W•2 sorting pages - color and B&W•2 data collection pages - color and B&W•3 candy corn addition sheets •candy corn number matching pageHOW TO USE: Grab a bag (or two) of Autumn Mix Candy Corn! Give a handful to each student and let the graphing fun begin! WORK ON: Counting and Card
Grades:
Not Grade Specific
Types:
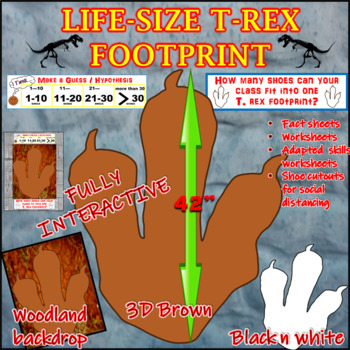
Life-Size T-Rex Dinosaur Footprint/Differentiated/Scientific Method / Adapted
To get weekly updates on new product releases, please FOLLOW us.Eager to stretch the minds of your students?Want them to be able to learn how to hypothesize a scientific wonder?This does just that! And More!This listing contains a LIFE-SIZE T-REX Footprint that measures 33 1/4” wide, and 42” long. You will absolutely LOVE this resource!Both my wife and I are Special Education/Life Skills Teachers, and we are constantly trying new ways to engage our students. One of the best ways we have found is
Subjects:
Grades:
Not Grade Specific
Types:
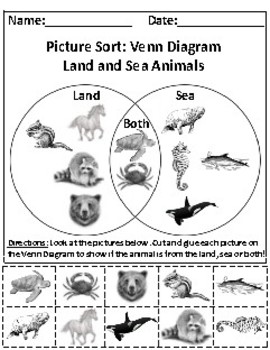
Land and Sea Animals Picture Sort Graph Activity - Aligned to RI.K.7 , RI.K.9
Topic of Activity: Land and Sea Animals Theme: Animals / NatureSubjects: Writing + ScienceActivity: Venn Diagram Graphing ActivitySkills Developed: *Students develop fine motor skills through cutting and gluing.*Students develop organizational skills through graphing on a Venn Diagram.* SAVE PREP TIME * BUILD YOUR RESOURCES * OFFER LEARNERS MORE! *Store Motto: For the cost of a cup of coffee, save hours of classroom planning!Copyright © 2018 EasyasABCALL RIGHTS RESERVED.
Subjects:
Grades:
PreK - K, Not Grade Specific
Types:
Showing 1-24 of 660 results


