249 results
Adult education graphing printables
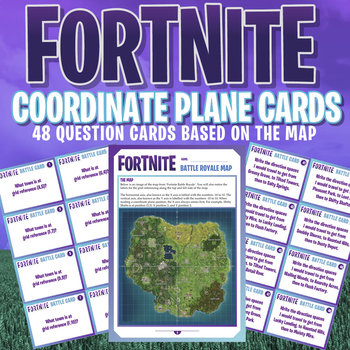
FORTNITE - MATHS - COORDINATE PLANE ACTIVITY CARDS - 48 Question Cards!
SEE OUR EXCITING NEW FORTNITE WORD PUZZLES HERE!HIGH INTEREST - HIGH ENGAGEMENTAn incredible set of 48 question cards, based on the wonderful Fortnite Battle Royale map. Map sheet included!Questions range from the basic naming place at certain coordinate plane reference, right through to the higher level, label the coordinate references of path taken along a designated journey!Great fun for the entire class, and for students of all levels!Check out also the HIGH RESOLUTION MAP PACK available fro
Subjects:
Grades:
4th - 10th, Higher Education, Adult Education, Staff
Types:
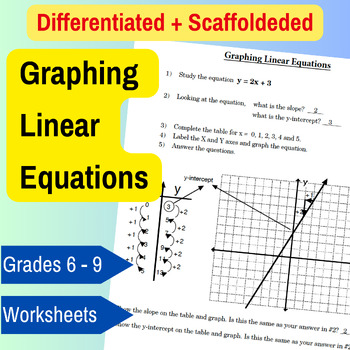
Scaffolded Activities: Exploring Graphing Linear Equations Through Patterns
Looking to engage your students with activities that help them grasp the concepts of linear equations, slope, and y-intercept? This introductory, scaffolded resource is precisely designed for that purpose. It employs patterns to introduce these fundamental concepts, demonstrating how growth slope, y-intercept, t-tables, and graphing linear equations interconnect. Prep is quick and easy! The 14-page lesson plan guides you on introducing each concept using guiding questions to introduce key patter
Subjects:
Grades:
6th - 9th, Adult Education
CCSS:

Linear Functions Interpret Rate of Change in RealWorldSituations *DISTANCE LRNG.
PRINT and DIGITAL * * Makes distance planning so much easier!Linear Functions Interpret Rate of Change in Real World SituationsLinear Functions Interpret Rate of Change in Real World Situations, has 10 different real world situations that require students to think critically about linear functions. The real world situations get more challenging as students progress through each situation. TPT buyers said, "Great resource.", "Great resource. I like particularly how they get more challenging.",
Subjects:
Grades:
7th - 11th, Adult Education
Types:
CCSS:
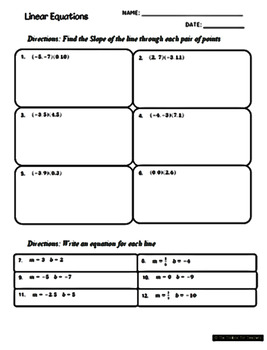
Linear Equations Quiz Review Slope Graphing Slope Intercept Skills Homework
Linear Equations Quiz Review Slope Graphing Slope Intercept Skills HomeworkThis PDF Worksheet contains 18 problems and the Answer Key.(6) problems: Calculating Slope(6) problems: Writing equations when given the “m” and “b”(4) problems: Write each equation in Slope Intercept Form. Then identify the slope & the y-intercept.(2) problems: Graphing Slope Intercept FormI appreciate your feedback and product ratings. Let’s connectThe Toolbox for Teachers on PinterestThe Toolbox for Teachers on Fac
Subjects:
Grades:
8th - 12th, Adult Education
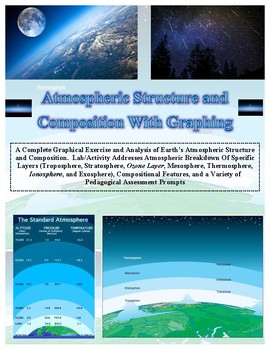
Atmospheric Layers Structure and Graphing LAB (An Earth Science Favorite!)
PROCEEDS BENEFIT "REACH INC."-EMPOWERING ADULTS WITH DISABILITIES
http://www.reachinc.org
Great COMBINATION of both math and science! This is an updated version by Southern Science Specialists.
New content, assessment prompts, and graphical template.
---------------------------------------------------------------------------------------------------------
See the "Extended Version" that additionally addresses the atmospheres of other planets found at the link below
CLICK HERE FOR EXTENDED VER
Subjects:
Grades:
5th - 10th, Adult Education
Types:
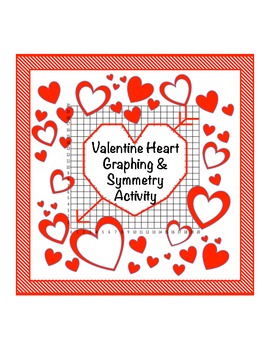
Valentine Day Graph
Valentine Day graph and symmetry activity for coordinate plane
Not only do students need to know how to graph line segments they will use their symmetry skills to complete the Valentine Day heart.
This file contains 8 pages.
Heart Graph in Quadrant I in color
Heart Graph in Quadrant I with black and white graphics
Heart Graph in Quadrant I with outline graphics
Heart Graph in Quadrant I Key
Heart Graph in Quadrant I, II, III, and IV in color
Heart Graph in Quadrant I, II, III, and IV with b
Subjects:
Grades:
5th - 12th, Higher Education, Adult Education
Types:
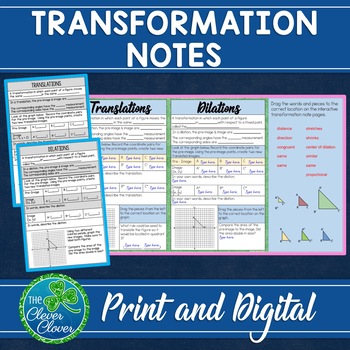
Transformation Notes - Print and Digital - Google Slides
This NO PREP resource can be used to strengthen your students understanding on Transformations. Included you will find print and digital transformation notes. This resource can be used with a Google Classroom, distance learning and homeschooling.Please see the PREVIEW for an idea of what is included.This resource involves four pages of interactive notes on translations, dilations, rotations and reflections. Each note page provides an opportunity for students to complete the definition, examine a
Grades:
7th - 9th, Adult Education
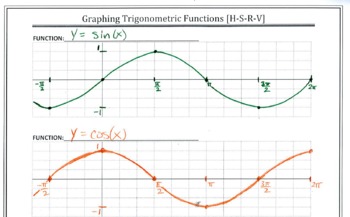
Graph Paper for Trig Functions
This changes everything! Student work becomes more consistent. Your grading will be so much easier! Using the four aligned graphs makes translations of trig functions crystal clear. This file has 2 pages of coordinate planes for graphing trig functions.The first page contains four blank graphs per page. The axes are unlabeled so that students may select their own scale.The second page has five blank graphs per page and is set up for conducting transformations on the coordinate plane.Please see
Subjects:
Grades:
10th - 12th, Higher Education, Adult Education

Square Root Function Graph Transformations - Notes, Charts, and Quiz
Square Root Function Graph Transformations - Notes, Charts, and Quiz
I have found that practice makes perfect when teaching transformations.
In this bundle you will find....
1. A chart depicting the 8 basic transformations including function notation and description. (Perfect for notes.)
2. A chart depicting the 8 basic transformations without the equation. (I have my students use this sheet as a graphic organizer.
3. A chart depicting the 8 basic transformations without the graph. (Great for
Grades:
7th - 12th, Higher Education, Adult Education
Types:
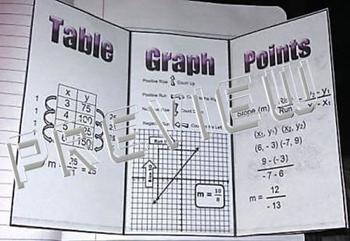
Calculate Slope Foldable Graphic Organizer Interactive Notebook
This is a 2 page PDF file that displays the 3 most common ways to calculate slope: the Slope Formula, a Table of Values and from a Graph.
The foldable is meant to be double-side printed to create a tri-fold brochure style document.
Download the free preview to see the details of the foldable.
FOLLOW ME ON TpT!
REMEMBER TO LEAVE FEEDBACK & A RATING TO EARN TpT CREDITS (details below)
TpT Credits
http://www.teacherspayteachers.com/Tptcredits
How it Works
Earn TpT Credits for purchases
Subjects:
Grades:
6th - 12th, Adult Education
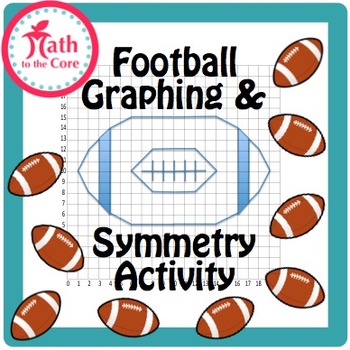
Football Graph and Symmetry Activity for Coordinate Plane
Football Graph and Symmetry Activity for Coordinate Plane
Not only do students need to know how to graph line segments they will use their symmetry skills to complete the football.
This file contains 8 pages.
Football Graph in Quadrant I in color
Football Graph in Quadrant I in black & white
Football Graph in Quadrant I without graphics
Football Graph in Quadrant I Key
Football Graph in Quadrant I, II, III, & IV in color
Football Graph in Quadrant I, II, III, & IV in black &
Subjects:
Grades:
5th - 12th, Higher Education, Adult Education
Types:
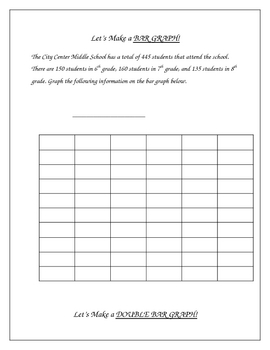
Constructing Graphs - Bar Graphs, Line Graphs, Circle Graphs
**I revised the numbers in the pie graph on this from the first version, these amounts are much more friendly** This activity includes construction of a bar graph, double bar graph, line graph, double line graph, and a circle graph.I put this together after being frustrated about not being able to find any graphing activities appropriate for intermediate grades that would allow me to make graphs with the class on my smartboard. I needed some examples to demonstrate how to take data and create a
Subjects:
Grades:
3rd - 10th, Adult Education
Types:
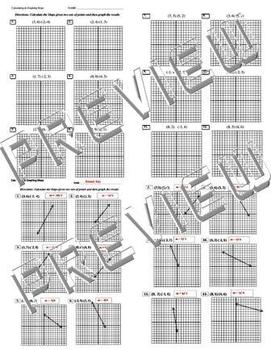
Calculate and Graph Slope Rise Over Run Worksheet Quiz Review Practice
This is a PDF worksheet that provides 12 problems for calculating slope given two sets of ordered pairs and graphing the rise over run.
The PDF file contains the answer key.
Your feedback/product rating is appreciated
FOLLOW ME ON TpT!
Subjects:
Grades:
6th - 12th, Adult Education
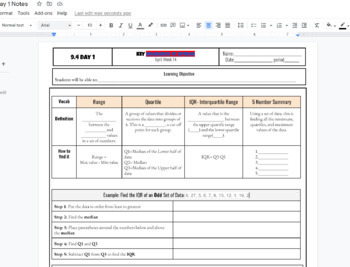
IQR interquartile Range and 5 number summary box and whisker plot Notes
IQR interquartile Range and 5 number summary box and whisker plot Notes including Q1, Q2, Q3, Min and Max and step by step both examples of finding the IQR and creating a box and whisker plot. Used in HS math 1 class WITH KEY INCLUDED AS a link to a printable PDF
Subjects:
Grades:
7th - 12th, Higher Education, Adult Education
CCSS:
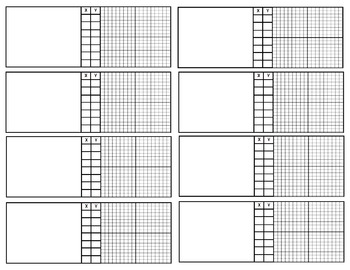
Functions Tables & Graphs Work Paper Templates IEP Accommodations
Functions Tables & Graphs Graphic Organizer Work Paper Templates
This file includes 3 PDF documents:
Function Tables: 2-page PDF that provides 20 Function Tables
Function Tables & Graphs: 2-page PDF that provides 12 Tables & Graphs
Function Tables, Graphs with Blank Work Space: 2-page PDF that provides 16 Function Tables, Graphs and Blank Work Space.
I use these templates instead of requiring my students to draw their tables and graphs on paper.
Using this work paper helps my st
Subjects:
Grades:
6th - 12th, Adult Education
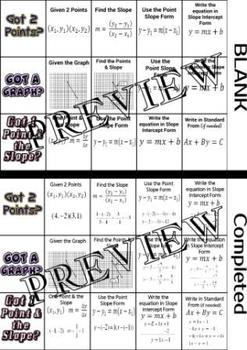
Writing Linear Equations Foldable Interactive Notebook A-CED.1, A-CED.2, A-REI.3
This file contains (2) single page PDF documents that explains the process of writing linear equations when given certain information: points, a graph or points and slope.
The file includes (2) different forms of the same document: (1) is partially completed with room for students to complete an example and (1) is already completed with an example for those students that struggle to understand concepts and/or need extra help.
The document can be used as a foldable for an Interactive Notebook
Subjects:
Grades:
6th - 12th, Adult Education
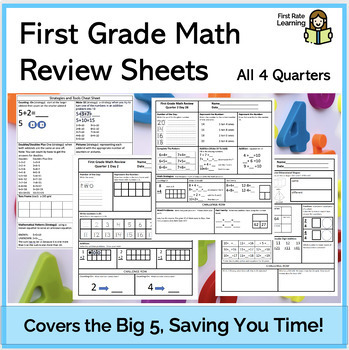
Quarters 1-4 Standards Based Daily Spiral Math Review (Morning Work/Bell Work)
Your first graders will thrive with these spiraling morning work printable. Focusing on equations w/ sums less than 10, this packet includes Written Numbers, Number Sense, Counting-On, Doubles, Fact Family, Missing Addends, Partners for 10, Count-On to Subtract, and Word Problems. You will also find challenge problems for those needing a little more.Quarter 1Focus on equations with sums less than 10Week 1-Count-On to AddWeek 2-DoublesWeek 3-Fact FamilyWeek 4-Missing AddendsWeek 5-Partners for 10
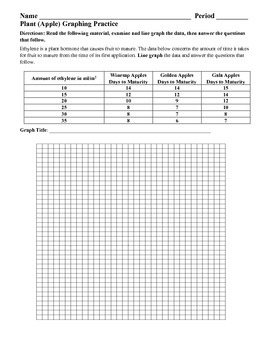
Graphing Practice for Science with Critical Thinking Questions
This is a double sided worksheet for students to practice graphing using data from a plant. Critical thinking questions also follow the creation of the graph for practice with data analysis and higher order thinking skills.
Grades:
9th - 12th, Adult Education
Types:
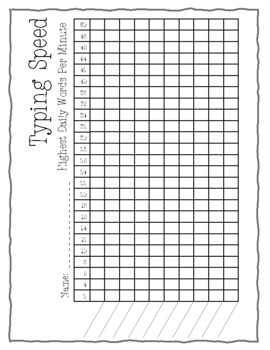
Words Per Minute Typing Graph
Keyboarding is an important skill today, especially for grades 3-5! This graph helps your students to keep track of their typing speed, encouraging more practice and determination! Students can write the date of their typing speed on the X axis, and graph their speed using the y axis (skip counting by 2s).These are great for data folders, Student-Led Conferences, and just real-life graphing skills!
Subjects:
Grades:
K - 12th, Higher Education, Adult Education, Staff
Types:
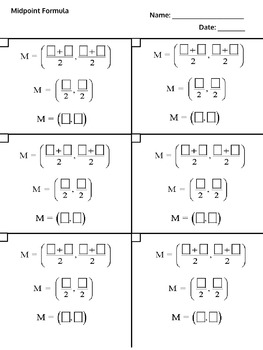
Midpoint Formula Work Paper Flow Chart Template IEP Accommodation
Midpoint Formula Work Paper Flow Chart Template IEP Accommodation
This is a single page PDF document that provides the steps needed to complete problems involving the Midpoint Formula.
Instead of traditional notebook paper, I use this template when I introduce the Midpoint Formula. Using this work paper helps my students keep their work organized while reminding them of the next step in the process.
Additionally, I project one on the whiteboard so that I can model the skill.
This work pape
Subjects:
Grades:
5th - 12th, Adult Education
Mean, Median, Mode, Range, Outlier, Quartiles, Box and Whisker Plots
Definitions, examples, and problems to help students learn the concepts and remember them!
Concepts presented:
• Mean
• Median
• Mode
• Range
• Outlier
• Quartiles, Box-and-Whisker Plots
The worksheets include: 3 pages of definitions and examples, 3 pages of problems, and 3 pages of solutions.
******************************************************************
Feedback → TpT Credits → Discount on a future purchase!
After you purchase and review a product, you will be given a chance to prov
Subjects:
Grades:
7th - 9th, Adult Education
Types:
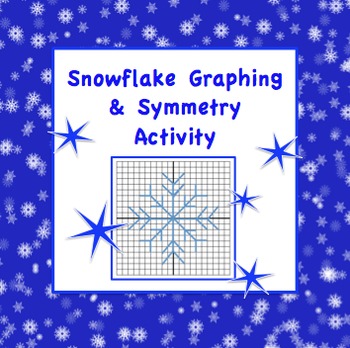
Snowflake Graph and Symmetry Activity for Coordinate Plane
Snowflake Graph and Symmetry Activity for Coordinate Plane
Not only do students need to know how to graph line segments in all four quadrants, they will use their symmetry skills to complete the snowflake.
Of course an answer key is provided!
ENJOY!!!
Connect with Me
Follow my WebsiteMath to the Core on FacebookMath to the Core BlogMath to the Core on PinterestMath to the Core on TwitterMath to the Core on Instagram
Grades:
7th - 12th, Higher Education, Adult Education
Types:
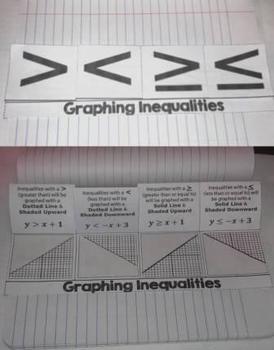
Graphing Inequalities Foldable Graphic Organizer Interactive Notebook A-REI.
This is a single page PDF foldable that explains the rules for graphing inequalities on the coordinate plane. The foldable shows when to use a “dotted line” vs. a “solid line” as well as when to “shade up” or “shade down”.
The document’s design allows for it to be used as a foldable, a graphic organizer or even a study guide.
The downloaded file will contain the folding directions.
Check out my foldable that shows how to graph inequalities on a number line
Inequalities on a numberline
Foll
Subjects:
Grades:
6th - 12th, Adult Education
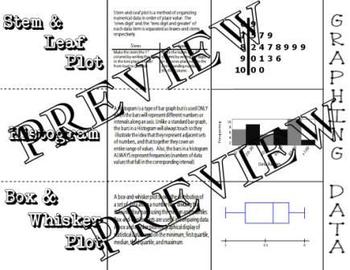
Graphing Data Histogram Box Whisker Stem Leaf Plot Foldable Interactive Notebook
Graphing Data Histogram Box Whisker Stem Leaf Plot Foldable Interactive Notebook
This is a single page PDF foldable that explains the differences in Histograms, Box and Whisker Plots and Stem and Leaf Plots, as well as shows an example of each.
The folding directions are included.
All feedback is welcomed
Follow Me on TpT!
Subjects:
Grades:
4th - 12th, Adult Education
Showing 1-24 of 249 results


