64 results
Adult education graphing scaffolded notes
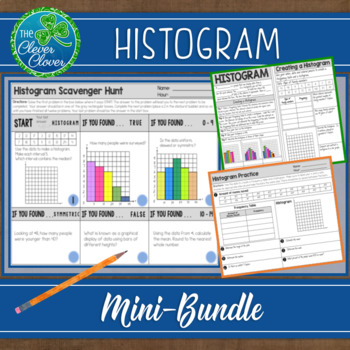
Histogram - Notes, Practice Worksheets and Scavenger Hunt
This histogram resource includes guided notes, a practice worksheet and a scavenger hunt. Your students will have the opportunity to create, interpret and discuss histograms. Below, you will find a detailed description of the notes, worksheet and scavenger hunt. Guided NotesThere are two small pages of guided notes. The first page provides the definition of a histogram and step by step instructions on how to create a histogram. The bottom portion of the notes has students examine three types (un
Subjects:
Grades:
6th - 9th, Adult Education
CCSS:
Also included in: Statistics Bundle - Guided Notes, Worksheets & Scavenger Hunts!
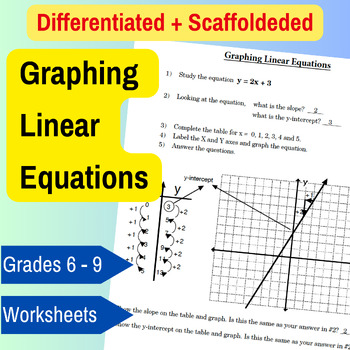
Scaffolded Activities: Exploring Graphing Linear Equations Through Patterns
Looking to engage your students with activities that help them grasp the concepts of linear equations, slope, and y-intercept? This introductory, scaffolded resource is precisely designed for that purpose. It employs patterns to introduce these fundamental concepts, demonstrating how growth slope, y-intercept, t-tables, and graphing linear equations interconnect. Prep is quick and easy! The 14-page lesson plan guides you on introducing each concept using guiding questions to introduce key patter
Subjects:
Grades:
6th - 9th, Adult Education
CCSS:
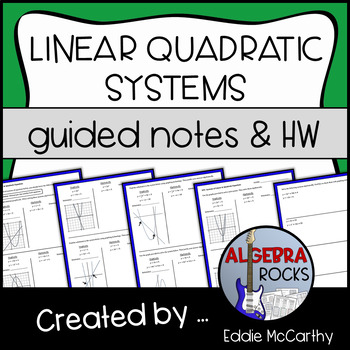
Linear Quadratic Systems of Equations Guided Notes and Homework
This lesson is part of my Quadratic Functions UnitThis lesson includes 3 pages of guided notes and a 2 page assignment.Students learn about linear quadratic systems in the order below. They will:- Recall what it means to be a “solution” to a system- Solve 3 systems using provided graphs, then algebraically (GCF factoring, trinomial a=1, GCF trinomial a=1)- Solve 2 systems using graphing technology, then algebraically (trinomial a>1, quadratic formula)- Solve a final system using a provided gr
Subjects:
Grades:
7th - 12th, Adult Education
CCSS:
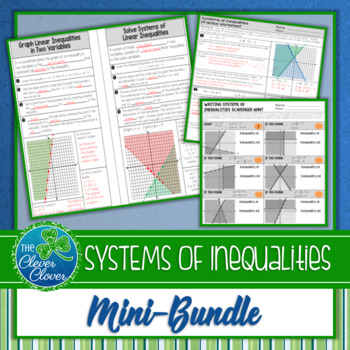
Systems of Inequalities - Guided Notes, Worksheets and a Scavenger Hunt
Included you will find guided notes, a worksheet and a scavenger hunt. Students will practice graphing systems of inequalities and writing inequalities from the graphed solutions. Looking for quality resources on systems of inequalities? This is it!The guided notes were designed on two half pages. These are perfect for students to glue in their notebooks to use as a reference. The first page of notes guides students through graphing linear inequalities in two variables. Students can fill in key
Grades:
7th - 9th, Adult Education
Also included in: Systems of Equations Bundle
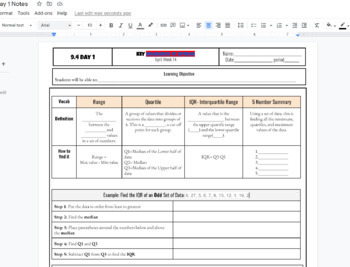
IQR interquartile Range and 5 number summary box and whisker plot Notes
IQR interquartile Range and 5 number summary box and whisker plot Notes including Q1, Q2, Q3, Min and Max and step by step both examples of finding the IQR and creating a box and whisker plot. Used in HS math 1 class WITH KEY INCLUDED AS a link to a printable PDF
Subjects:
Grades:
7th - 12th, Higher Education, Adult Education
CCSS:
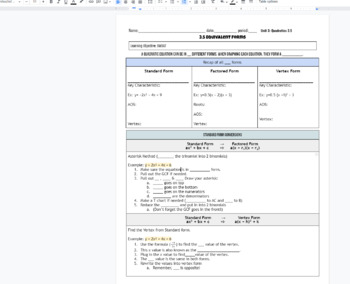
Converting between 3 forms of quadratic equations (equivalent functions) notes
Unit 3: 3.5 Converting between 3 forms of quadratic equations (equivalent functions) notes. In these scaffolded notes / graphic organizers students convert between standard, factored, and vertex form quadratic equations. The notes are broken up to show the steps on how to go from one to another. This also tells how a parabola can look like 3 different equations.Doc is editable. KEY is included in title and at the bottom of the doc. math 2 HS class. (see 3.1, 3.2, 3.3, 3.4 for previous notes!)
Subjects:
Grades:
7th - 12th, Higher Education, Adult Education
CCSS:
Also included in: Quadratic Forms & Characteristics Unit Notes & Homework

Desmos Graphing Project (Review)
This project is meant as a review of linear functions as well as transformations in the coordinate plane (translations, reflections, rotations, dilations). Students get to choose which transformation to perform, so it does not "review all transformations". Students use Desmos to outline a letter, usually an initial, (restricting domain and range) and then transform it within Desmos (in a table). For easier projects: pick transformations for students to perform (translations, dilations) and walk
Grades:
8th - 12th, Higher Education, Adult Education
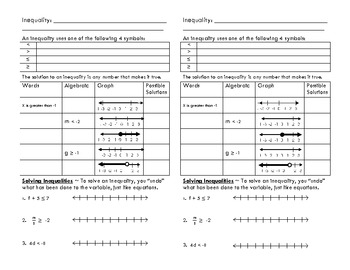
Inequalities - Scaffolded Notes for Math
This is a half-page that my students fill out during a mini-lesson and glue into their math journals. It has an overview of the 4 symbols and what they mean, a table to practice using the various symbols, and then three problems at the end for students to practice solving and graphing one-step inequalities.
Grades:
5th - 8th, Adult Education
Types:
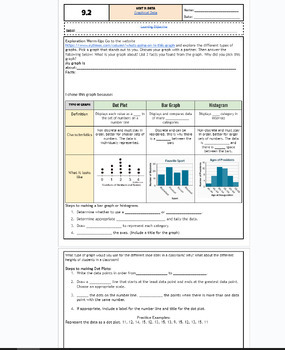
Graphical Data: Bar Charts, Dot Plots and Histograms fillable notes UPDTD
Unit 9: Data and Stats: UpdatedUpdated9.2 Graphs: bar, dot plot, histpgramStudents go over the vocabulary and define each type fo graph and what data fits for each graph. The warm up is an exploratory activity where students go on a website to search for their graph of interest and discuss the key findings. This takes around 10-15 mins and students enjoyed it! Notes are scaffolded. Includes hook video hyperlinked on the "learning objective" title. Key is included and hyperlinked as a PDF in the
Subjects:
Grades:
6th - 12th, Higher Education, Adult Education
CCSS:
Also included in: Unit 9: Data and Statistics Fillable Notes
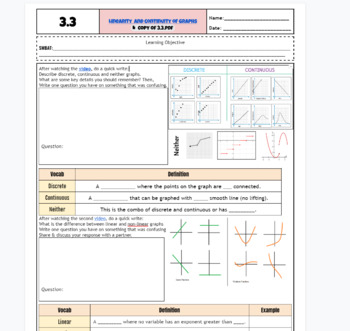
Discrete & continuous graphs (Linearity & Continuity) scaffolded notes w/ videos
3.3 Unit 3 Linearity and Continuity Lesson, this goes over the difference between discrete and continuous graphs and also what is linear and what is non-linear. Students use two different discussions warm up by watching a video from Youtube (LINKED ON THE NOTES!) to define the vocab in their own words. Many examples are given. Then students see the algebraic breakdown of linear and non linear equations. KEY IS INCLUDED linked in the title and bottom of the page with videos. Google doc is editabl
Grades:
7th - 12th, Higher Education, Adult Education
CCSS:
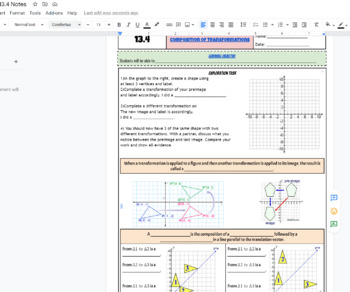
Compositions of Transformations Fillable Notes and Homework KEY included
Compositions of Transformations Fillable Notes and Homework KEY included (13.4) students will perform and know the difference between glide reflections and nonglide reflections. Students will perform 2 different transformations such as a translation than a reflection on the translation. Notes are scaffolded and fillable with images, live link to the website, warm-up exploration task to define the other transformations, and homework or practice with the key included (highlighted in red in the tit
Grades:
7th - 12th, Higher Education, Adult Education
CCSS:
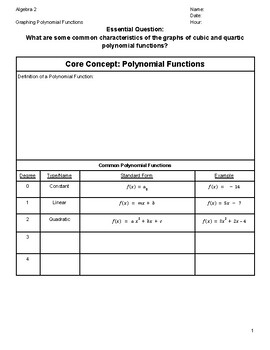
Algebra 2-Graphing Polynomial Functions Guided Notes w/Key
Guided notes on graphing various even and odd polynomial functions with key included. Organized way of taking notes with students with opportunities for independent practice.Topics include:-Identifying polynomial functions-Evaluating polynomial functions given "x"-Graphing even and odd polynomial functions and showing end behavior-Describing end behavior
Subjects:
Grades:
10th - 12th, Adult Education
CCSS:
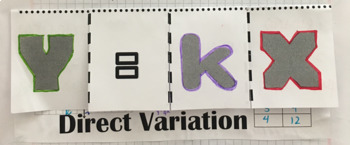
Direct Variation Foldable
Direct Variation Foldable designed for an interactive notebook. I have included two sizes, a large size with one foldable for an 8.5x11 page and a small size with two foldables for an 8.5x11 page which is more reasonable for a typical class size. This foldable introduces direct variation with vocabulary, the elements of the general equation y=kx, creating a table for a direct variation equation and then graphing the equation on a coordinate plane, and identifying the constant of variation from
Subjects:
Grades:
6th - 12th, Higher Education, Adult Education
CCSS:

Linear Forms Unit fillable notes
Unit of Linear Forms fillable notes5.0 review of slope intercept form and graphing5.1 slope intercept form and finding "b"5.2 Point slope form5.3 standard formAll notes include keys that are hyperlinked as a pdf in the header and at the bottom of each doc.
Grades:
6th - 12th, Higher Education, Adult Education
CCSS:
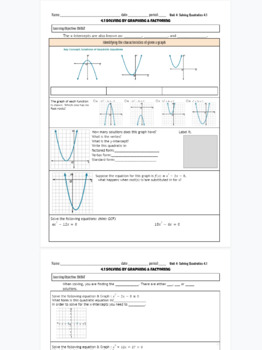
Solve Quadratic Equations by Graphing and Factoring fillable notes
Unit 4: Solving Quadratics 4.1 solve by graph and factoring fillable/scaffolded notes. (See Unit 3 for previous lessons). Students have learned all about the characteristics of quadratics including factoring, now they solve and see what the solutions represent on the graph. Using the zero product property and seeing the x-intercepts. This google doc is editable. KEY is included in the title and bottom of the doc. Used in HS math 2.
Subjects:
Grades:
7th - 12th, Higher Education, Adult Education
CCSS:
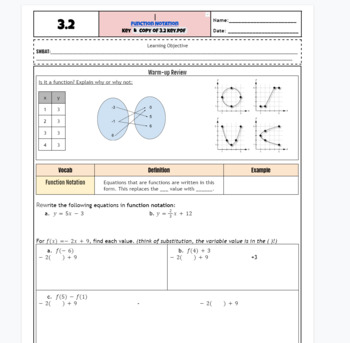
Function Notation scaffolded notes and practice
3.2 Unit 3 Relations/ Functions, this is the second lesson on function notation. Plugging in the value of x into a function to solve for the output of y. Includes a review warm-up of what a function is and is not in terms of a table, graph, and mapping. Includes word problems and fillable steps to solving with algebra. Used in Math 1 HS class. KEY IS INCLUDED in the title and at the bottom of the next page. Linked. THis google doc is editable to your liking and titles.
Grades:
7th - 12th, Higher Education, Adult Education
CCSS:
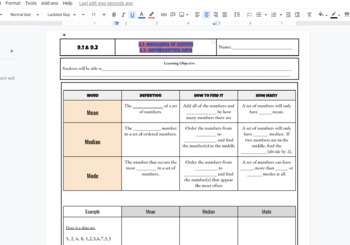
Mean, Median, Mode and Dot plot, bar graph histogram Fillable Notes Scaffolded
Central Tendencies: Mean, Median and Mode Fillable Notes Scaffolded used in math 1 classroom to introduce the data unit. Also includes dot plot, histogram and bar chart lesson. KEY IS INCLUDED!
Subjects:
Grades:
7th - 12th, Higher Education, Adult Education
CCSS:
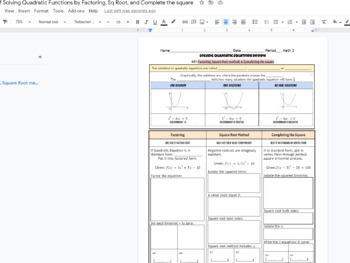
Solve quadratics by square root, complete the square, factoring notes graph org
Solve quadratics by square root, complete the square, factoring notes graph organizer with KEY INCLUDED! Practice problems on the back that can be completed by either square rooting, completing the square or factoring. Shows what the discriminant means and how the solutions/roots/ zeroes look on the parabola. This is one of the sections of the lesson review. See Quadratic formula notes for other methods & Solve by factoring notes for more resources! Used in Math 2 HS class
Subjects:
Grades:
7th - 12th, Higher Education, Adult Education
CCSS:
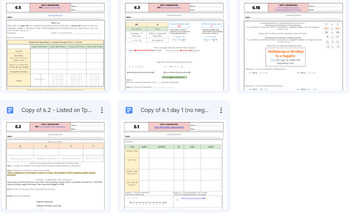
Inequalities Unit Fillable Notes & Key Only
Inequalities Unit is 5 (plus 1 ) google docs scaffolded notes with keys6.1 One variable inequalities6.1 B One variable inequalities when mult/divide by a negative 6.2 Solve inequalities with variables on both sides6.3 Compound Inequalities6.5 Graphing Linear Inequalities (Includes 7.5 system of inequalities Systems Unit)All keys are on each google doc in the header and at the bottom of the doc hyperlinked as a pdf
Grades:
7th - 12th, Higher Education, Adult Education
CCSS:
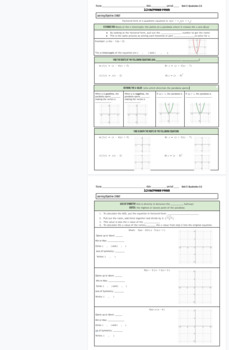
Factored Form of a quadratic equation scaffolded notes and graphing
Unit 3. 3.3 Factored form of quadratic functions. Students learn how the factored form of quadratic equations gives the solutions, zeroes, x-intercepts or roots of a parabola. They use different types fo factored equations to show 1 solution, 2 solutions. Google doc is editable. Graphic organizer. Fillable notes. KEY INCLUDED linked in title and on bottom of doc. Used in HS math 2 class. See 3.1, and 3.2 for previous lessons!
Subjects:
Grades:
7th - 12th, Higher Education, Adult Education
CCSS:
Also included in: Quadratic Forms & Characteristics Unit Notes & Homework
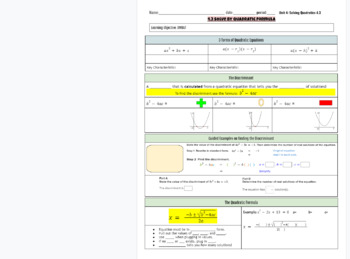
Solve quadratic equations by the quadratic formula fillable notes
Unit 4: 4.3 Solve by Quadratic Formula (See 4.1 and 4.2 for previous notes) fillable notes / graphic organizers. This is scaffolded and includes visuals of the graphs / solutions!. First students learn about finding the discriminant only by seeing the discriminant formula and telling how many solutions the answer gives. Then they use the quadratic formula to find the actual solutions along with the number of solutions. These fillable notes are on a google doc and editable. Used in HS math 2 clas
Subjects:
Grades:
7th - 12th, Higher Education, Adult Education
CCSS:
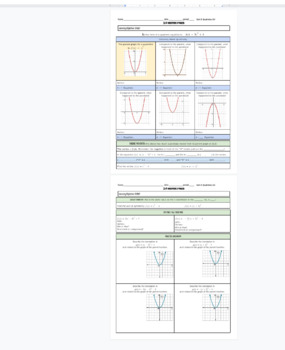
Vertex form of a quadratic equation (translations) scaffolded notes
Unit 3: Quadratics 3.4 Vertex Form of quadratic functions scaffolded notes / graphic organizer, fillable notes for class instruction. Students find the vertex in vertex form, and visually see how vertex form is translating the parent graph based on the h and k values. The warm-up helps students ease into the lesson by slowly moving the graph piece by piece. Google doc is editable and KEY IS INCLUDED on title and linked on bottom of the doc. See the 3.1, 3.2, and 3.3 notes for previous lessons!U
Subjects:
Grades:
7th - 12th, Higher Education, Adult Education
CCSS:
Also included in: Quadratic Forms & Characteristics Unit Notes & Homework
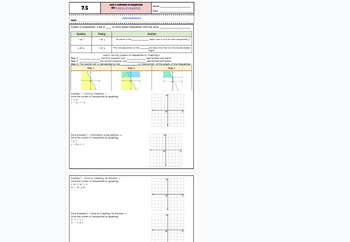
Graphing Systems of Inequalties Fillable Notes
Unit 7: Systems of Equations7.5 Systems of InequalitiesSWBAT solves systems of inequalities by graphing and shading two inequalities (linear) on the same plane. The double-shaded region is the solution area. Students need to put the linear inequalities into slope-intercept form and determine the characteristics befoe graphing.Intro video: link in the learning objectiveKey hyperlinked in the header and at the bottom of the doc as a PDFUsed in Math1 class.
Subjects:
Grades:
7th - 12th, Higher Education, Adult Education
CCSS:
Also included in: Inequalities Unit Fillable Notes & Key Only
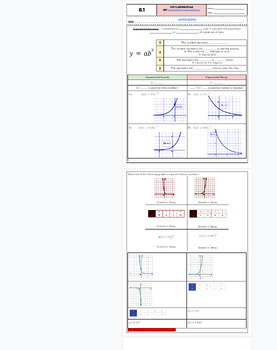
Characteristics of Graphing Exponential Functions Scaffolded Notes
UPDATED: Unit 8: 8.1 Graphing Exponential FunctionsStudents learn the characteristics of the equation of exponential functions and define all the variables to see the y-intercept, what makes it decay or grow, and the rate of decay and growth. The key is linked in the header as a pdf and also at the bottom of the google doc. Doc is editable to your liking. In their class practice, students learned to graph by plugging values into the formula from a table (this is not on the notes but it is explai
Grades:
6th - 12th, Higher Education, Adult Education
CCSS:
Showing 1-24 of 64 results


