15 results
Algebra laboratories $5-10
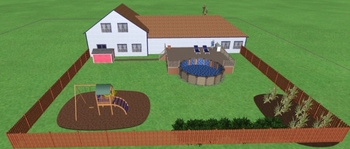
Backyard Project - Perimeter, Area, and Volume - Real World Applications
This project is the culmination of the perimeter, area, volume unit. It can be used as a task for the Common Core, or real world application of the measurement unit. Students estimate the cost to build a backyard, with a swimming pool, deck, shed, playset area, garden, and brick walkway. Using the calculations and costs associated with purchasing materials needed to construct the different parts, students will generate the total cost of the project, without labor. With the dimensions provide
Grades:
8th - 10th
Types:
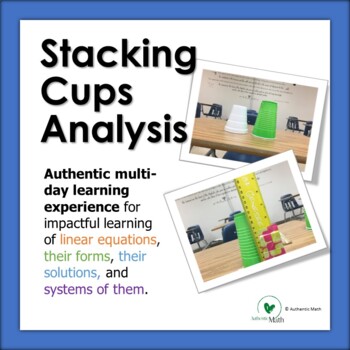
Stacking Cups Analysis - an authentic in-depth discovery of linear equations!
Starting with a simple question, your class will embark on a three-to-five-day authentic learning experience that will allow your students to develop an intuitive understanding of rate of change, initial value, forms of linear equations, systems of linear equations, and their solutions! Ready?This is a three-part learning experience.In Stacking Cups students independently* try to answer the question "How many cups does it take to make a stack as tall as your teacher?" by taking measurements and
Subjects:
Grades:
7th - 10th
Types:
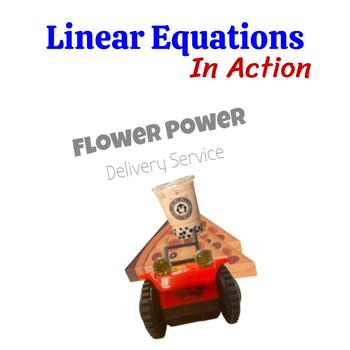
Linear Equations in Action
In this experiment, your students will dive into the world of hands-on mathematics, making real predictions that they can put to the test. It's not just about numbers on paper; it's about using math to solve real-world problems and answer the questions that matter. With this assignment, you'll empower your students to:Record Data: They'll collect real-world data through multiple trials, refining their observation and recording skills.Graph Like Pros: They'll create scatter plots that visually re
Subjects:
Grades:
8th - 12th
Types:
LEGO Robotics Introduction
Here's a 10-15 day set of activities for introducing the LEGO Mindstorms Robots! In this packet, you get:* SEVEN Robot activities!* An EXCEL Activity creating a multiple line graph.* Programming challenges from basic to hard.* Build Guide for "Reece's Runner" Robot* Robot Challenge Design PlansI use this as a 10-day Module in my classroom.
Grades:
5th - 8th
Types:
Distance, Rate and Time
This lab will get your students up and moving! And guess what? It's a MATH lab. That's right --I'm combining exercise and math over here :-)
The target level for this lab is algebra 1 (typically 8th or 9th graders), but some advanced pre-algebra students will be able to handle it as well. Students should have a very basic understanding of systems of linear equations and percent error calculations before jumping into this activity.
The hands-on portion of this lab is written to be conducted o
Subjects:
Grades:
7th - 9th
Math Lab An Algebra Review Via Hands-on Glider Investigation
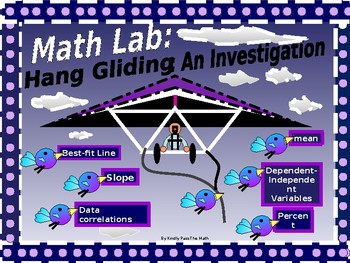
Please join me in my enthusiasm for Math Lab Investigating Gliders!The lab is a two day event that covers and reviews multiple concepts covered in Algebra I, semesters I and II* It is outstanding for bringing concepts back to students prior to finals and for assisting them in applying mathematics to real life situations.* This 50 page investigation requires the student to address the relationship between the wing-span of a glider and the distance that it can fly.* On day one, students work in
Subjects:
Grades:
7th - 12th, Higher Education, Adult Education
Types:
Graphing Calculator Learning Lab
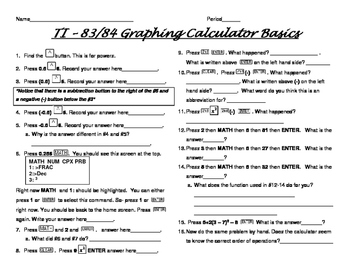
Student will learn some basic commands for the Texan Instruments 83 & 84 calculators
Subjects:
Grades:
7th - 12th
Types:
Everything on Quadratics
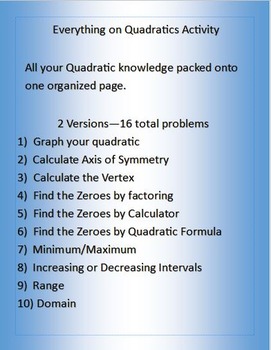
Use this activity to help your students discover and practice Quadratics. It covers graphing, quadratic formula, factoring, zeroes, roots, solutions, x-intercepts, axis of symmetry, min/max, increasing/decreasing intervals, and the vertex. Everything is on one page, so students learn that there are multiple ways to find the zeroes of a quadratic. Their knowledge allows them to pick the best method. This pack includes 2 versions, 16 total problems, all problems worked out in the included key.
Subjects:
Grades:
8th - 12th
Types:
X vs Y: A Variable Recording and Graphing Lab
A 3 day to week long laboratory exploration into independent and dependent variables, and how equations like y=mx+b can describe the relationships between them.After breaking down the lab's instructions, students will get to choose their own x and y variables and then come up with a procedure for gathering data. Depending on how outgoing/creative they are, collecting the data for this lab can be a blast! Once they have 20 (x,y) samples, they will graph them and draw a line that fits the data. Th
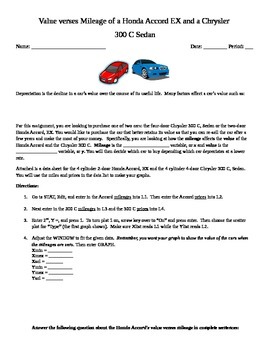
Value verses Mileage of a Honda Accord EX and a Chrysler Systems Problem
In this lesson activity, students explore the value verses mileage of two different cars. The students use linear regression find a line of best fit for the value vs. mileage of each car. The two lines form a system of linear equations. Using their data and equations, students can determine when the values of the cars will be the same and decide which car depreciates at a slower rate.
Subjects:
Grades:
9th - 11th
Types:
CCSS:
Parallax Measurements, and Determining the Distances and Heights of Objects
Embarking on an exploration into the realms of applied mathematics, this project uncovers how such mathematical principles can be utilized to determine the solar parallax of distant celestial bodies. The task set forth aims to expand students' understanding of mathematical applications within the context of real-world phenomena. By bridging the gap between abstract mathematical theory and tangible cosmic observations, the project aims to foster an appreciation for the interconnectedness of diffe
Subjects:
Grades:
6th - 12th
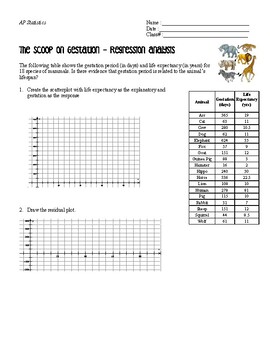
The Scoop on Gestation: Influential Points and Linear Regression
This lab takes a look at the average gestation of a variety of animals and asks students to perform a linear regression analysis. It explores the impact of influential points. The lab incorporates verbiage that should be used on the AP Exam and formal analyses.
Subjects:
Grades:
9th - 12th, Higher Education
Types:

Middle School Math Workshop: Red and White Pattern Exploration
Are you using workshop-style lessons in your middle school math classroom? If you're not you should: they are easy to prep for, allow for differentiated learning, and instant assessment.If we want our students to actually learn the facts, concepts, and ideas we’re trying to teach them, they have to experience those things in some way that rises above abstract symbols on paper. They have to process them. Manipulate them.To really learn in a way that will stick, they have to DO something. Worksho
Subjects:
Grades:
6th - 9th
Types:
Theory in Practice
This activity requires students to flip a coin 100 times and calculate the cumulative probability for each trial of ten. Students should begin to develop the concept of theoretical versus experimental probability as the cumulative number of flips increases. Recognizing independent events, graphing scatter plots, and calculating percentages are skills students will practice during this activity. Teachers may use this activity as an introductory lesson for a unit on probability, in a statistics
Subjects:
Grades:
7th - 12th
Types:
Patterns in Polygons
This activity requires students to create diagonals in various polygons to determine the sum of the measures of the angles in those polygons and the total number of diagonals that can be constructed in each polygon. In addition to pattern recognition and developing formulas, students graph the data they collect to demonstrate linear and non-linear functions. Teachers can use this activity in an Algebra or Geometry course.
Grades:
7th - 12th
Types:
Showing 1-15 of 15 results


