109 results
12th grade laboratories for Microsoft Excel

BACK TO SCHOOL BUBBLEGUM SCIENCE LAB
Break the ice of the first few days of back to school science class, while teaching your students your expectations of how to write an excellent lab report. This fun, high interest student lab does just that. In groups of three, students will chew bubblegum and measure the bubbles to see if sugar free bubblegum makes bigger bubbles than regular bubblegum. Students can collect their data on the form provided and use our pre-formatted Microsoft Excel spreadsheet to create a line chart and colu
Subjects:
Grades:
7th - 12th
Types:
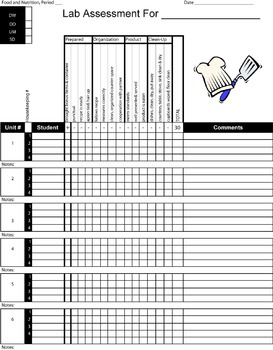
Foods Lab Evaluation Sheet 2 - Teacher Version
This is another template to collect data / assess and evaluate students' performance in the foods lab.
This template is in an Excel format so you can have a master copy for your students' names and change and edit as you go.
The categories for assessment are:
Prepared
Organization
Product
Clean Up
There are 3-4 criteria that fall under each category.
Subjects:
Grades:
4th - 12th
Types:

Experiment Analysis: Acid Base Titration in AP Chemistry Utilizing a pH Meter
The Advanced placement AP Chemistry Acid Base Titration Experiment Lab Curve Analysis Using a pH Meter is a "tried and true" lab designed to take 45-50 minutes and I have used it in my AP Chemistry classroom for over 15 years. The lab includes an excel template for students to easily make the titration curve and includes directions.Upon the conclusion of this lab students will be able to:Perform a titration accurately and quickly (I do this lab in one 50 minute period). Make a titration curve u
Subjects:
Grades:
10th - 12th, Higher Education
Types:
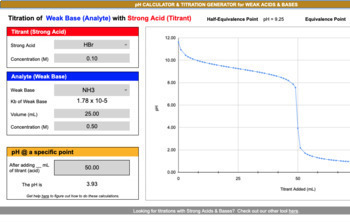
pH Calculator & Titration Curve Generator - WEAK Acids & Bases
We created this useful online titration curve generator and pH calculator tool so that you can enjoy effortless, reliable and quick acid-base titration reaction calculations. In addition to viewing the titration curve generated from a variety of weak acid and base choices, the major points on the curve are also included: equivalence and half-equivalence points. Interested to know the pH at a specific point according to different volume and molarity inputs? You are in luck. This tool allows you
Subjects:
Grades:
7th - 12th, Higher Education, Adult Education
Types:
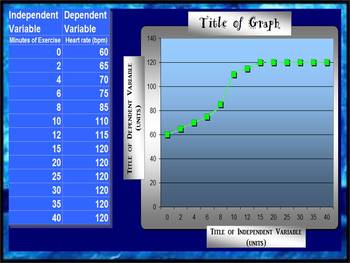
LINE GRAPH MAKER (AUTOMATIC)
This spreadsheet allows you to insert your independent and dependent variables into a chart and voila!... a line graph is generated as you enter in each piece of new data! Students love to take their data from a lab and watch as a graph is made right before their eyes! You can change all of the titles on the chart and the graph to suit your classes laboratory experiment needs! Students can easily print out their data to include in their lab reports!
Grades:
2nd - 12th
Types:
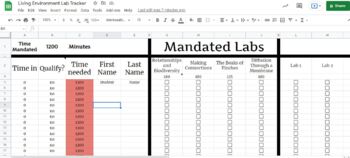
Living Environment Lab Tracker
Throughout the year, students are required to complete 1200 minutes of labs and their accompanying questions. This google sheets allows teachers to monitor students progress to see if they are on track for completion of lab minutes. It calculates the time student have completed and highlights the names of students that are regents ready
Subjects:
Grades:
8th - 12th
Types:
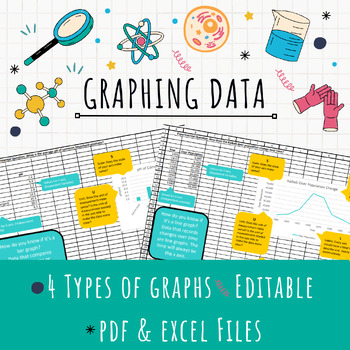
EDITABLE Excel Graphing Template
Teach graphing in Excel with this EDITABLE template! After collecting data, have your students represent it in a formal graph using Excel. This template provides helpful tips for students to determine the right kind of graph (bar, line, or pie) for their data and ALSO teaches them all the important parts of a graph.Assign the template for students to download and edit for a quick graphing solution or provide the pdf handouts for students who just need a little guidance!4 different kinds of graph
Grades:
7th - 12th
Types:
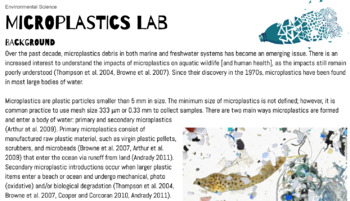
Microplastics Lab (Microscopic Analysis, Chemical Isolation, Food)
This is one of my favorite labs to do with my Environmental Science kids! It has 3 parts: Microscopic analysis of beach sand (you can substitute with any substrate you think might have microplastics!), microscopic analysis of everyday objects (I have my students look at food/snacks that they bring in, and do a dissection of clams/mussels from the grocery store), and chemical isolation/digestion of microplastic-containing samples of muck (we get ours from a pond and a beach). For the chemical dig
Subjects:
Grades:
8th - 12th, Higher Education, Adult Education
Types:
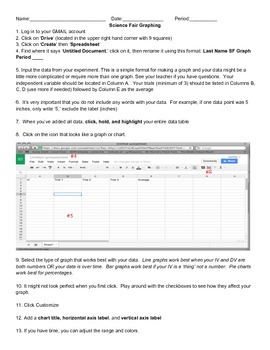
How To Graph Using Google Spreadsheets
This is a step-by-step guide on how to use Google Spreadsheets for students in grades 5-12. Use this as a resource when guiding students through the process. Included with the directions is sample data for students to use when practicing graphing. Perfect for science experiments and science fair!
Subjects:
Grades:
5th - 12th
Types:
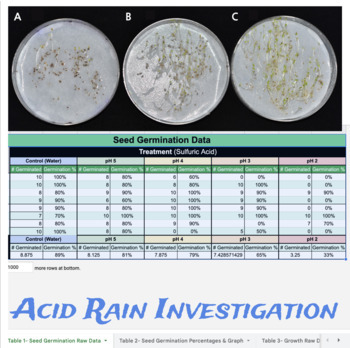
Acid Rain Lab Investigation (A Seed Germination Study)
INCLUDED:Google Doc with Google Sheet Link!Google Sheets with automatically perform ALL calculations and produce graphs! In this lab, students model the effects of acid rain on plant structure and function by studying seed germination in various pH treatments. In this investigation students will expose the seeds to various solutions of acid treatments and document the effects on seed germination. By exposing the seeds to various pH levels in a controlled environment, students can determine at wh
Subjects:
Grades:
7th - 12th
Types:
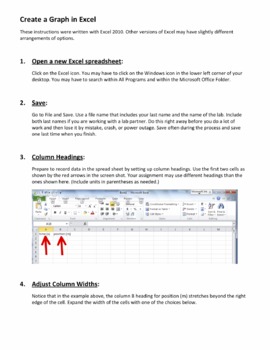
Create Line Graphs in Excel
This instruction guide walks students (and us teachers) through the process of entering data into an Excel spreadsheet and turning it into a line graph. This 10-page guide contains numerous screen shots to help explain each step.
The guide can be used along with laboratory investigations and projects common to physics, chemistry, and biology, as well as courses in mathematics, economics, meteorology, sociology, etc. If your students need to learn how to graph the data they collect, this guide w
Subjects:
Grades:
8th - 12th
Types:
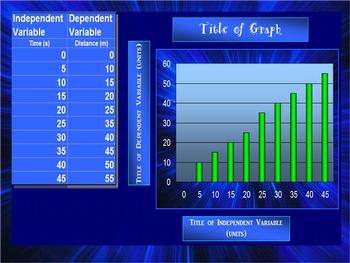
BAR GRAPH (AUTOMATIC)
This spreadsheet allows you to insert your independent and dependent variables into a chart and voila!... a bar graph is generated as you enter in each piece of new data! Students love to take their data from a lab and watch as a graph is made right before their eyes! You can change all of the titles on the chart and the graph to suit your classes laboratory experiment needs! Students can easily print out their data to include in their lab reports!
elementary science class, middle school sc
Grades:
2nd - 12th
Types:
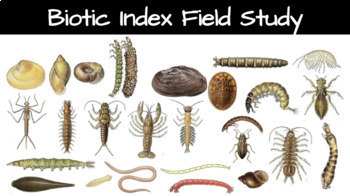
Biotic Index Field Study
In this outdoor Field Study, students compare the ecological health of two freshwater sites based on macroinvertebrate biodiversity found using leaf packs. GOOGLE DOC & easy to use GOOGLE SHEETS INCLUDED!Also includes Quizlet Set and other Resources!STEPS:Collect leaves and place them in a mesh or coconut fiber bundle (leaf pack).Students place the "leaf pack" on the bottom of a freshwater stream.Students will return to the sites to collect the leaf packs after 1-3 weeks. Bins, dissection
Subjects:
Grades:
8th - 12th, Higher Education
Types:
NGSS:
HS-LS2-2
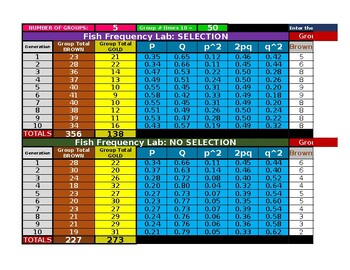
Fish Frequency Lab (Companion Spreadsheet) for Hardy Weinberg Equilibrium
This is the companion spreadsheet that will help calculate and display class data for the lab.Understanding natural selection and the Hardy-Weinberg Equilibrium equation can be confusing and difficult.Let this lab activity help clear some of the confusion for your students! In this laboratory activity, you will use fish crackers to help further your understanding of natural selection and the role of genetics and gene frequencies in evolution and natural selection.The only supplies you need are 2
Grades:
9th - 12th, Higher Education, Adult Education
Types:
NGSS:
HS-LS4-2
, HS-LS4-1
, HS-LS4-6
, HS-LS4-3
, HS-LS4-4
...

The Effect of Cell Size and Osmolarity on Diffusion Rates Laboratory
This bundle provides the following materials: the laboratory handout for the lab, a spreadsheet designed for importing, processing and presenting student data, a rubric for grading and supplemental directions if you wish students to complete their own serial dilutions.
Subjects:
Grades:
11th - 12th
Types:
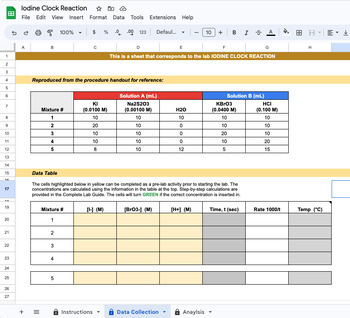
Iodine Clock Reaction - GoogleSheet Data & Analysis Tool
This product relates to the popular chemistry lab: Iodine Clock Reaction. Often performed as a demo for students, this is a hands-on lab that students can explore determining rate laws through this reaction. Check out the lab procedure for FREE here. This Guided Lab Analysis tool provides a structured way to enter data and then have the calculations performed for you automatically! This is great for:Quick way to check student work and calculationsCalculations can automatically be completed once
Subjects:
Grades:
8th - 12th, Higher Education, Adult Education
Types:
6 Do At Home Physics Labs
These labs can be performed in school or at home with or without partners. Equipment needed: m&m’s; cell phone or watch w stopwatch function, clay or Play Dough; small stones; a marble or a golf ball; a couple of rulers or small sticks; a 2-foot board or cookie baking sheet; 2 books or boards to slap together to make a loud noise. Included are:1. Measuring the acceleration of gravity. Drop stones out of a second story window or down a stairwell and measure fall times with stopwatch on a c
Subjects:
Grades:
10th - 12th
Types:
CCSS:
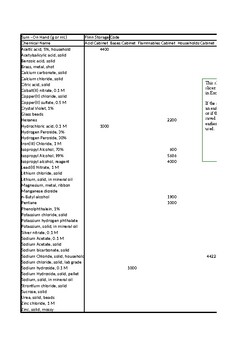
Chemical and General Inventory Spreadsheet
This spreadsheet allows you to create a database of materials (chemicals, equipment, etc.), assign a location, keep track of amounts, and updates automatically. It even prints chemical labels with the appropriate Hazards! Make sure to download the instructions from my page as well!
Subjects:
Grades:
9th - 12th, Staff
Types:
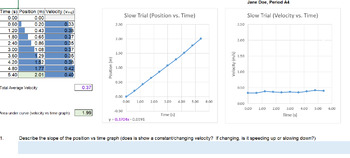
Water Droplet Velocity and Displacement Activity
This is a fairly simple to perform data collection activity to illustrate the concepts of one-dimensional motion and the associated graphing techniques. Students will use plastic water bottles to perform a series of motions and collect data. The data can then be analyzed using included Excel automatically calculating workbooks in two follow-up lessons. This activity can easily be performed in a distance learning setting as it uses materials found in most households.
Subjects:
Grades:
8th - 12th
Types:
CCSS:
NGSS:
HS-PS2-1

Science Lab Report Classical Conversations Challenge II Editable
I edit and use this to help my homeschooler with lab reports. We use it for Classical Conversations Challenge 2 Apologia Biology. You can use it for other curriculums. It is editable.
Grades:
8th - 12th
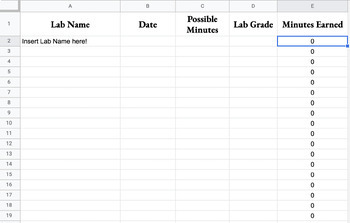
New York Regents Lab Minute Tracker (Self-Scoring)
New York State requires students obtain 1200 lab minutes in order to be eligible for the Regents Science Exams (Living Environment, Earth Science, Chemistry, and Physics). This tracker helps students stay accountable. This lab tracker requires students to update their copy to match yours. This will encourage students to become familiar with using google sheets. They will be responsible to enter basic formulas so the sheet can automatically tabulate if they earn the lab minutes according to NYS g
Subjects:
Grades:
8th - 12th
Types:
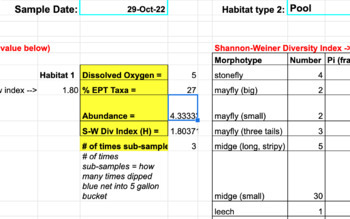
Stream Ecology: Benthic Macroinvertebrate Data Sheet (Part 4)
Data sheet in google sheets which is template for collecting/analyzing data for stream ecology sampling lab for Benthic Macroinvertebrates (Stream Bugs/Aquatic Insects) to middle, high school, or college students! Includes calculations on Biodiversity (% EPT Taxa, Dissolved Oxygen, and Shannon-Wiener Index). This spreadsheet can accomodate many different sampling groups and tabulates results in final sheet.~~ Note: this is PART 4 of larger STREAM ECOLOGY AQUATIC INSECT SAMPLING bundle - you can
Subjects:
Grades:
9th - 12th, Higher Education
Types:
NGSS:
HS-LS2-3
, HS-LS2-4
, HS-LS2-1
, HS-LS2-6
, HS-LS2-2
Also included in: Stream Ecology Lab: Benthic Macroinvertebrates (FULL BUNDLE!)

Google Spreadsheet: Shoe Cleaning Lab
The "Making Babies Lab: Baby Yoda" and "Characteristics of Life Lab" had such great feedback from other educators I thought I would go ahead and make a similar one with one of my favorite introductory experiments: the "The Perfect Clean" Virtual Lab!Guiding Question: Which cleaning methods are most effective for cleaning tennis shoes?Supplementary Resources: Instructional Video Part 1Teacher Tips:1. Hook (CTE Connection:) Introduce students to the topic by showing them some videos of new busines
Grades:
6th - 12th, Higher Education
Types:
NGSS:
MS-ESS3-2
, MS-ESS3-1
, MS-ESS3-5
, MS-ESS3-4
, MS-ESS3-3
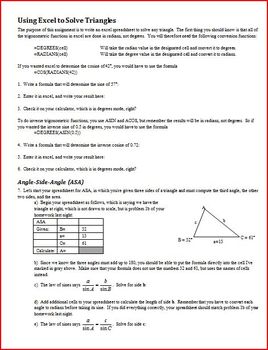
Solving Triangles using Excel (Editable)
I think that when we use technology in the classroom with our students, we should teach them to use technology as a tool. One of the best applications for using a spreadsheet in class is in the solution of triangles. After my students have mastered the laws of sines and cosines with handheld calculators, and are familiar with the ambiguous case, I have them redo the same problems using excel.
It is a very challenging activity for them.
NOTE: Your students will need to have access to a comp
Subjects:
Grades:
10th - 12th
Types:
Showing 1-24 of 109 results


