50 results
Higher education laboratories for Microsoft Excel

Experiment Analysis: Acid Base Titration in AP Chemistry Utilizing a pH Meter
The Advanced placement AP Chemistry Acid Base Titration Experiment Lab Curve Analysis Using a pH Meter is a "tried and true" lab designed to take 45-50 minutes and I have used it in my AP Chemistry classroom for over 15 years. The lab includes an excel template for students to easily make the titration curve and includes directions.Upon the conclusion of this lab students will be able to:Perform a titration accurately and quickly (I do this lab in one 50 minute period). Make a titration curve u
Subjects:
Grades:
10th - 12th, Higher Education
Types:
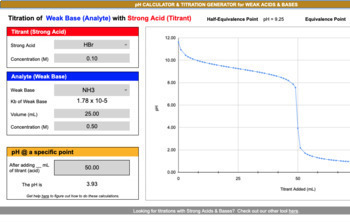
pH Calculator & Titration Curve Generator - WEAK Acids & Bases
We created this useful online titration curve generator and pH calculator tool so that you can enjoy effortless, reliable and quick acid-base titration reaction calculations. In addition to viewing the titration curve generated from a variety of weak acid and base choices, the major points on the curve are also included: equivalence and half-equivalence points. Interested to know the pH at a specific point according to different volume and molarity inputs? You are in luck. This tool allows you
Subjects:
Grades:
7th - 12th, Higher Education, Adult Education
Types:
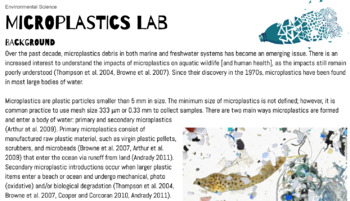
Microplastics Lab (Microscopic Analysis, Chemical Isolation, Food)
This is one of my favorite labs to do with my Environmental Science kids! It has 3 parts: Microscopic analysis of beach sand (you can substitute with any substrate you think might have microplastics!), microscopic analysis of everyday objects (I have my students look at food/snacks that they bring in, and do a dissection of clams/mussels from the grocery store), and chemical isolation/digestion of microplastic-containing samples of muck (we get ours from a pond and a beach). For the chemical dig
Subjects:
Grades:
8th - 12th, Higher Education, Adult Education
Types:

Biotic Index Field Study
In this outdoor Field Study, students compare the ecological health of two freshwater sites based on macroinvertebrate biodiversity found using leaf packs. GOOGLE DOC & easy to use GOOGLE SHEETS INCLUDED!Also includes Quizlet Set and other Resources!STEPS:Collect leaves and place them in a mesh or coconut fiber bundle (leaf pack).Students place the "leaf pack" on the bottom of a freshwater stream.Students will return to the sites to collect the leaf packs after 1-3 weeks. Bins, dissection
Subjects:
Grades:
8th - 12th, Higher Education
Types:
NGSS:
HS-LS2-2
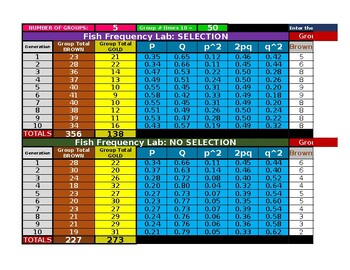
Fish Frequency Lab (Companion Spreadsheet) for Hardy Weinberg Equilibrium
This is the companion spreadsheet that will help calculate and display class data for the lab.Understanding natural selection and the Hardy-Weinberg Equilibrium equation can be confusing and difficult.Let this lab activity help clear some of the confusion for your students! In this laboratory activity, you will use fish crackers to help further your understanding of natural selection and the role of genetics and gene frequencies in evolution and natural selection.The only supplies you need are 2
Grades:
9th - 12th, Higher Education, Adult Education
Types:
NGSS:
HS-LS4-2
, HS-LS4-1
, HS-LS4-6
, HS-LS4-3
, HS-LS4-4
...
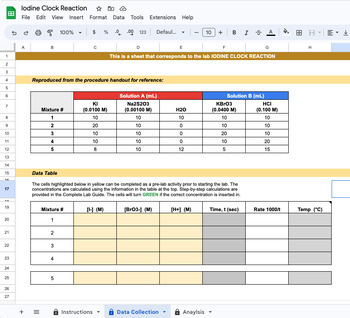
Iodine Clock Reaction - GoogleSheet Data & Analysis Tool
This product relates to the popular chemistry lab: Iodine Clock Reaction. Often performed as a demo for students, this is a hands-on lab that students can explore determining rate laws through this reaction. Check out the lab procedure for FREE here. This Guided Lab Analysis tool provides a structured way to enter data and then have the calculations performed for you automatically! This is great for:Quick way to check student work and calculationsCalculations can automatically be completed once
Subjects:
Grades:
8th - 12th, Higher Education, Adult Education
Types:
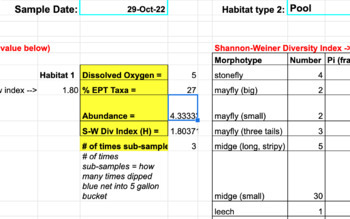
Stream Ecology: Benthic Macroinvertebrate Data Sheet (Part 4)
Data sheet in google sheets which is template for collecting/analyzing data for stream ecology sampling lab for Benthic Macroinvertebrates (Stream Bugs/Aquatic Insects) to middle, high school, or college students! Includes calculations on Biodiversity (% EPT Taxa, Dissolved Oxygen, and Shannon-Wiener Index). This spreadsheet can accomodate many different sampling groups and tabulates results in final sheet.~~ Note: this is PART 4 of larger STREAM ECOLOGY AQUATIC INSECT SAMPLING bundle - you can
Subjects:
Grades:
9th - 12th, Higher Education
Types:
NGSS:
HS-LS2-3
, HS-LS2-4
, HS-LS2-1
, HS-LS2-6
, HS-LS2-2
Also included in: Stream Ecology Lab: Benthic Macroinvertebrates (FULL BUNDLE!)

Google Spreadsheet: Shoe Cleaning Lab
The "Making Babies Lab: Baby Yoda" and "Characteristics of Life Lab" had such great feedback from other educators I thought I would go ahead and make a similar one with one of my favorite introductory experiments: the "The Perfect Clean" Virtual Lab!Guiding Question: Which cleaning methods are most effective for cleaning tennis shoes?Supplementary Resources: Instructional Video Part 1Teacher Tips:1. Hook (CTE Connection:) Introduce students to the topic by showing them some videos of new busines
Grades:
6th - 12th, Higher Education
Types:
NGSS:
MS-ESS3-2
, MS-ESS3-1
, MS-ESS3-5
, MS-ESS3-4
, MS-ESS3-3
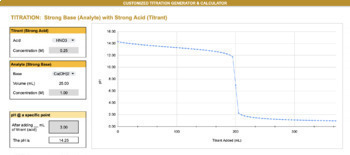
pH Calculator & Titration Curve Generator - Strong Acids & Bases
Create your own customized titration curves within seconds for worksheets, assessments, handouts or any other use!This resource comes with TWO generators/ calculators: 1. A titration of a strong acid with a strong base and 2. A titration of a strong base with a strong acid The customized generator allows YOU to CHOOSE:Chemical identity of the titrant AND analyteVolume of analyte being titratedConcentration of the analyteConcentration of the titrantPick and choose what combinations you
Subjects:
Grades:
6th - 12th, Higher Education
Types:
NGSS:
HS-PS1-7
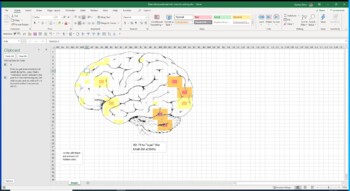
Lab Brain Scan Analysis Class Activity Psychology Neurology AP Psychology
This was originally the proof of concept spreadsheet for my brain scan lab. I realized that it might be useful on its own as an activity. You have to have excel to make this work,…I guess you might be able to use it with google sheets but I don’t know. Open the spreadsheet, and hit F9 to get a fresh “scan.” Areas with the most “activity” “light up.” You can edit the spreadsheet and change the colors if you want,…not sure that is necessary but it is fully editable. So how might you use this? May
Subjects:
Grades:
9th - 12th, Higher Education
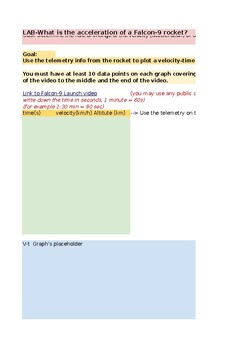
Study the acceleration of a Rocket - video analysis
Use video analysis to measure the acceleration of a falcon 9 rocket. How to determine the position, velocity, and acceleration of the rocket over time? How to use the data collected to analyze the rocket's motion? This lab activity is divided in four main sections, Introduction, data collection and data plotting , Analysis questions, and post-lab questions. any online source showing telemetry from a rocket launch may be used.
Subjects:
Grades:
9th - 12th, Higher Education, Adult Education, Staff
Types:
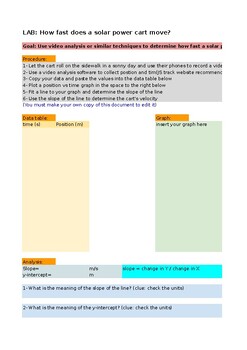
LAB - How fast is a solar cart?
Students study the motion of a solar powered cart using video analysis.Students will determine the speed of a solar cart from a position vs. time graph, and they will also be able to use the information from the chart to describe the motion. Is the velocity of the solar powered cart constant? How constant the velocity is?A video of the motion is uploaded for the video analysis, and a key is also provided. results may differ depending on the cart used.
Subjects:
Grades:
9th - 12th, Higher Education, Adult Education, Staff
Types:
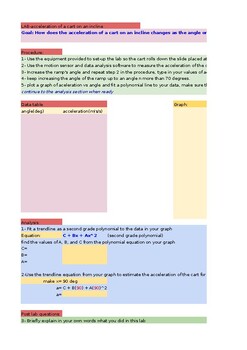
Acceleration of a cart in a ramp
Students will be able to measure the acceleration of a cart down the ramp for different inclination angles, collected data may be used to predict the acceleration of the cart for an angle of 90 degrees by extrapolation. A graph of acceleration vs. sine(angle) should yield a strait line with a slope equals to the free fall acceleration g. A key and student sample data is provided.
Subjects:
Grades:
10th - 12th, Higher Education, Adult Education, Staff
Types:

Homeostasis Heart Rate Lab
This lab can be used for middle school sciences, any Biology-based science class, or mathematics statistics classes. Included are a word document with instructions, lab, an excel spreadsheet with example data, a blank sheet with formulas that will calculate data, and a PowerPoint with student instructions.
Subjects:
Grades:
6th - 12th, Higher Education
Types:

Physics Lab Bundle: Interactive Spreadsheets
When run on a computer these 11 labs act like a teacher, flagging possible errors and encouraging students to do their best. They’re the result of my 13 years’ experience and are designed for an algebra-based physics course. All the files are templates, so they can’t be accidentally over-written. These interactive labs help students get the most out of the lab experience. When needed, error messages pop up addressing students by name, e.g.: “Mike, your calculations don’t follow from your input d
Grades:
10th - 12th, Higher Education
Types:
Predesigned Spreadsheet Solutions for Consumers and Business
Library of predesigned spreadsheet solutions useful for consumers and businesses. Included in this library are advanced spreadsheet solutions in support of finance and economics teaching as well as personal finance and planning. The spreadsheets can be used with Excel, Google Sheets and most open source electronic spreadsheets.
Subjects:
Grades:
Higher Education, Adult Education, Staff
Types:

Zoology Animal specimen lab post lab sheet (see Bundle)
Important Note: individual pieces of this lab are available separately in my store. I recommend getting the bundle to get the full lab. Because the lab includes a word doc, a power point and excel sheets I had to list items separately https://www.teacherspayteachers.com/Product/Kingdom-Animalia-Specimen-Lab-unit-3-5943527 Animal Specimen lab teacher instructions:This lab is designed to give students a chance to become familiar with terminology that they will be using throughout the zoology cours
Grades:
9th - 12th, Higher Education
Types:
Also included in: Kingdom Animalia Specimen Lab

Zoology Specimen Lab sheet 1 (see bundle)
Important Note: individual pieces of this lab are available separately in my store. I recommend getting the bundle to get the full lab. Because the lab includes a word doc, a power point and excel sheets I had to list items separately https://www.teacherspayteachers.com/Product/Kingdom-Animalia-Specimen-Lab-unit-3-5943527 Animal Specimen lab teacher instructions:This lab is designed to give students a chance to become familiar with terminology that they will be using throughout the zoology cours
Grades:
9th - 12th, Higher Education
Types:
Also included in: Kingdom Animalia Specimen Lab
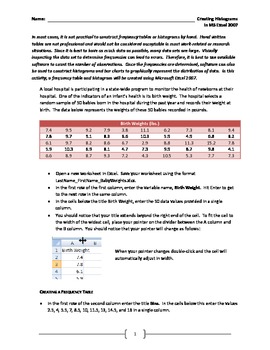
Creating Frequency Tables and Histograms in MS Excel 2007
This activity looks at a realistic data set and walks the student through constructing a frequency table and histogram using Microsoft Excel. It should be noted that Excel is not the best software package for creating histograms, but because it one of, it not the most widely used software package for data storage and presentation in business, it is important to know how to create professional-looking and statistically accurate graphics using this tool.
There are two different ways to constru
Subjects:
Grades:
11th - 12th, Higher Education
Types:
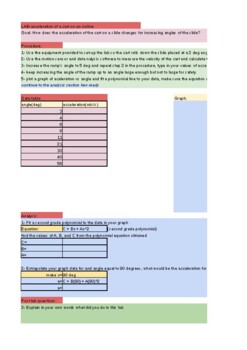
LAB-Acceleration of a cart on a tilting incline
Students investigate the acceleration of a cart down an incline for different incline angles, they will use the data obtained in this investigation to estimate the acceleration the cart would have if the angle is 90 degrees (vertical drop). This lab may be used to make the connection between accelerated motion and free fall motion.
Subjects:
Grades:
9th - 12th, Higher Education, Adult Education
Types:
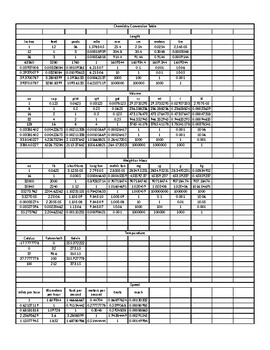
All in one conversion table
The conversion table has just about everything you need to make your daily conversions as well as the scientific conversions that are a bit tougher to do. This spreadsheet contains eight different conversion tables that are easy to use. Each conversion starts with one starting unit that is then converted to all other types of measurements within that group.
Subjects:
Grades:
3rd - 12th, Higher Education, Adult Education
Types:
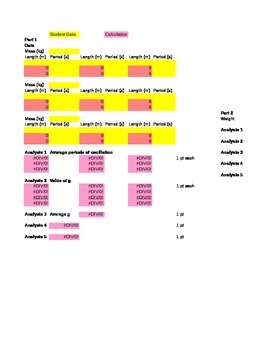
Universal Gravitation Lab Grading Spreadsheet
One of the greatest things about these labs is that each student (or lab group) is responsible for generating their own data, which leads to individual answers. The problem is that grading can be complicated…until now! These grading spreadsheets were originally only available on CD-ROM…but now they can easily be downloaded and used. When the teacher wants to grade a lab, they simply enter the student data into the yellow spreadsheet cells. Then the pink cells automatically calculate the answ
Subjects:
Grades:
7th - 12th, Higher Education
Types:
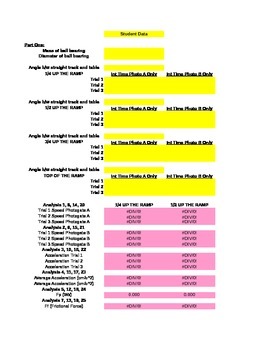
Inclined Planes and Friction Lab Grading Spreadsheet
One of the greatest things about these labs is that each student (or lab group) is responsible for generating their own data, which leads to individual answers. The problem is that grading can be complicated…until now! These grading spreadsheets were originally only available on CD-ROM…but now they can easily be downloaded and used. When the teacher wants to grade a lab, they simply enter the student data into the yellow spreadsheet cells. Then the pink cells automatically calculate the answ
Subjects:
Grades:
7th - 12th, Higher Education
Types:
Finding PI Using Excel
Data is taken to find the value of Pi through the measurements of circumference and diameter. The data is inputted into Excel to create a table for finding PI. A graph is generated to find the slope which is also Pi.
Grades:
7th - 12th, Higher Education
Types:
Showing 1-24 of 50 results

