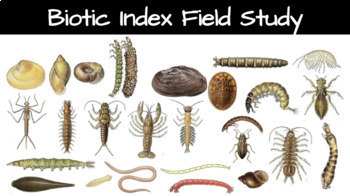
Biotic Index Field Study
Limulus Science
6 Followers
Grade Levels
8th - 12th, Higher Education, Homeschool
Subjects
Resource Type
Standards
NGSSHS-LS2-2
Formats Included
- Google Docs™
- Excel Spreadsheets
Limulus Science
6 Followers

Made for Google Drive™
This resource can be used by students on Google Drive or Google Classroom. To access this resource, you’ll need to allow TPT to add it to your Google Drive. See our FAQ and Privacy Policy for more information.
Description
In this outdoor Field Study, students compare the ecological health of two freshwater sites based on macroinvertebrate biodiversity found using leaf packs.
GOOGLE DOC & easy to use GOOGLE SHEETS INCLUDED!
- Also includes Quizlet Set and other Resources!
STEPS:
- Collect leaves and place them in a mesh or coconut fiber bundle (leaf pack).
- Students place the "leaf pack" on the bottom of a freshwater stream.
- Students will return to the sites to collect the leaf packs after 1-3 weeks. Bins, dissection trays, etc. needed to hold leaf packs.
- Students will identify macroinvertebrates using the guides. Tweezers and gloves are helpful as they sort through the leaves. Magnifying glasses, macrolenses, or dissecting scopes are also helpful.
- The Biotic Index Google Sheet will automatically calculate Pollution Tolerance Index (PTI) Score and EPT Richness Index
- The students will work together to analyze the data, produce graphs, and answer conclusion questions on a Google Doc.
GOOGLE DOC includes:
- Background Information
- Easy Hypothesis Selections via Google Doc
- Google Sheet (via link to make a copy) for collecting data, producing graphs, and calculating Pollution Tolerance Index (PTI) Score & EPT Richness Index
- Conclusion Questions
- Resources:
- Link to Quizlet Identification Set
- Links to Macroinvertebrate ID Guides
- Links to Leaf Pack Network where detailed "How To Guides" can be found.
Total Pages
Answer Key
N/A
Teaching Duration
2 days
Report this resource to TPT
Reported resources will be reviewed by our team. Report this resource to let us know if this resource violates TPT’s content guidelines.
Standards
to see state-specific standards (only available in the US).
NGSSHS-LS2-2
Use mathematical representations to support and revise explanations based on evidence about factors affecting biodiversity and populations in ecosystems of different scales. Examples of mathematical representations include finding the average, determining trends, and using graphical comparisons of multiple sets of data. Assessment is limited to provided data.


