8 results
2nd grade laboratories for Microsoft Excel
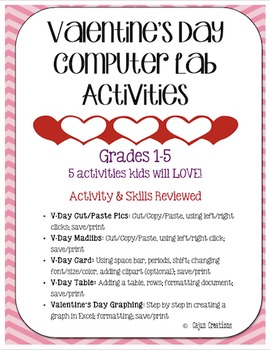
Valentine's Day Computer Lab Activities
There are 5 Valentine's Day activities using Microsoft Word & Microsoft Excel in this download!
Review the following skills as your students complete these activities!
• V-Day Cut/Paste Pics: Cut/Copy/Paste the matching word to the picture, using left/right clicks; save/print
• V-Day Madlibs: Cut/Copy/Paste words into blanks to make a funny story, using left/right click; save/print
• V-Day Card: Challenge students to type a personal message on the front, back, and insides of cards; use sp
Grades:
1st - 5th
Types:
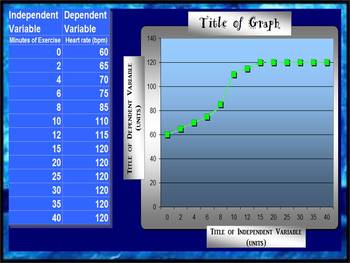
LINE GRAPH MAKER (AUTOMATIC)
This spreadsheet allows you to insert your independent and dependent variables into a chart and voila!... a line graph is generated as you enter in each piece of new data! Students love to take their data from a lab and watch as a graph is made right before their eyes! You can change all of the titles on the chart and the graph to suit your classes laboratory experiment needs! Students can easily print out their data to include in their lab reports!
Grades:
2nd - 12th
Types:
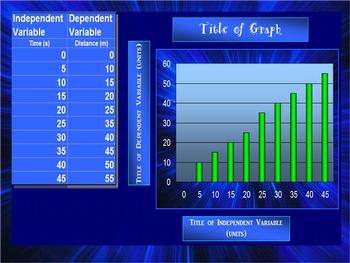
BAR GRAPH (AUTOMATIC)
This spreadsheet allows you to insert your independent and dependent variables into a chart and voila!... a bar graph is generated as you enter in each piece of new data! Students love to take their data from a lab and watch as a graph is made right before their eyes! You can change all of the titles on the chart and the graph to suit your classes laboratory experiment needs! Students can easily print out their data to include in their lab reports!
elementary science class, middle school sc
Grades:
2nd - 12th
Types:
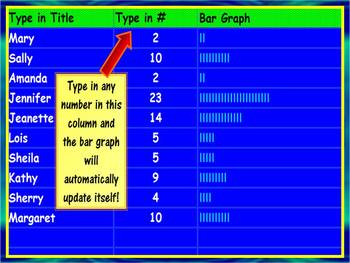
Automatic Bar Graph Maker
This activity can be used to teach students of all ages about bar graphs. This spreadsheet can be used to introduce the concept of bar graphs to elementary students as well as implemeted by mid-level & high school students in lab reports and/or presentations. It is extremely quick and easy to use! Just type in a set of numbers and it automatically creates a simple bar graph. And check out my other graph templates for line and bar graphs! They are definately worth your time!
Grades:
K - 12th
Types:

Design your own house: Adding,subtracting items in real life scenarios
Having trouble motivating your students with adding and subtracting double (or triple digit) addends. Use this great file. I created this excel spreadsheet to allow student to click and drag house layouts, furniture, and even plants to an area of land. Once they choose an item, they type it in the spread sheet and tally it up. There is a self check feature on each page to see if they added or subtracted correctly.
If you have extra time or you want to turn it into a game, print out the car
Subjects:
Grades:
1st - 4th
Types:
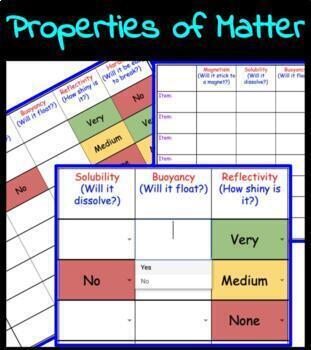
Properties of Matter Observation Worksheet
This color coded Google Sheet is perfect for the virtual classroom. It is formatted with color-coded dropdown lists, making it streamlined for easy grading. The nature of the formatting also makes this a great option for students requiring modifications. Educators are able to make a copy for each student in Google Classroom.
Subjects:
Grades:
2nd - 8th
Types:
NGSS:
5-PS1-3
, 2-PS1-2
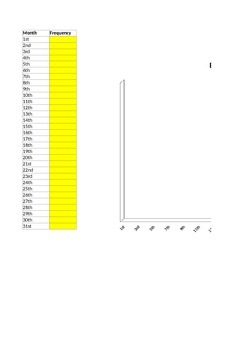
Birthday Frequency Graph - by Day of Month
An interactive Excel spreadsheet to graphically display the frequency of birthdays by day of the month. Simply fill in the yellow cells with the appropriate number and the chart will automatically update.
Subjects:
Grades:
1st - 5th
Types:
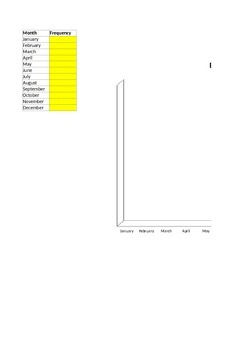
Birthday Frequency Graph - by Month of Year
An interactive Excel spreadsheet to graphically display the frequency of birthdays by month of the year. Simply fill in the yellow cells with the appropriate number and the chart will automatically update.
Subjects:
Grades:
K - 5th
Types:
Showing 1-8 of 8 results

